Introduction
The AlloSigMA server is a tool for estimating the allosteric free energies acting on a single residue as a result of either ligand binding, mutations, or both combined [1, 2]. Allosteric free energies quantify the strength and the sign of the allosteric communication that is associated with the effector binding and/or mutations. In particular, the sign of the allosteric free energy of a residue corresponds to the scenarios of increased dynamics (positive sign, local destabilization) and decreased dynamics (negative sign, local stabilization) respectively. The model framework implemented in AlloSigMA is based on the structure-based statistical mechanical model of allostery (SBSMMA) [3, 4] and on its extension to the concept of mutations [5, 6]. In the original SBSMMA the allosteric effect caused by the ligand binding is evaluated via a perturbation in the harmonic model associated with the protein unbound state. The scheme of the SBSMMA approach consists of three components (see Figure 1):
- The dynamics in the unbound (unperturbed) and bound (perturbed) protein forms is obtained from the normal modes of a C-alpha harmonic models;
- A per-residue allosteric potential evaluates the elastic energy associated with the local structural changes induced by the protein dynamics;
- By averaging over all possible neighbor
configurations of the residue in the bound and
unbound protein states (statistical mechanical
framework) the per-residue allosteric free energy is
obtained; this estimates the work exerted on a
residue of interest as a result of the allosteric
signaling induced by effector binding.
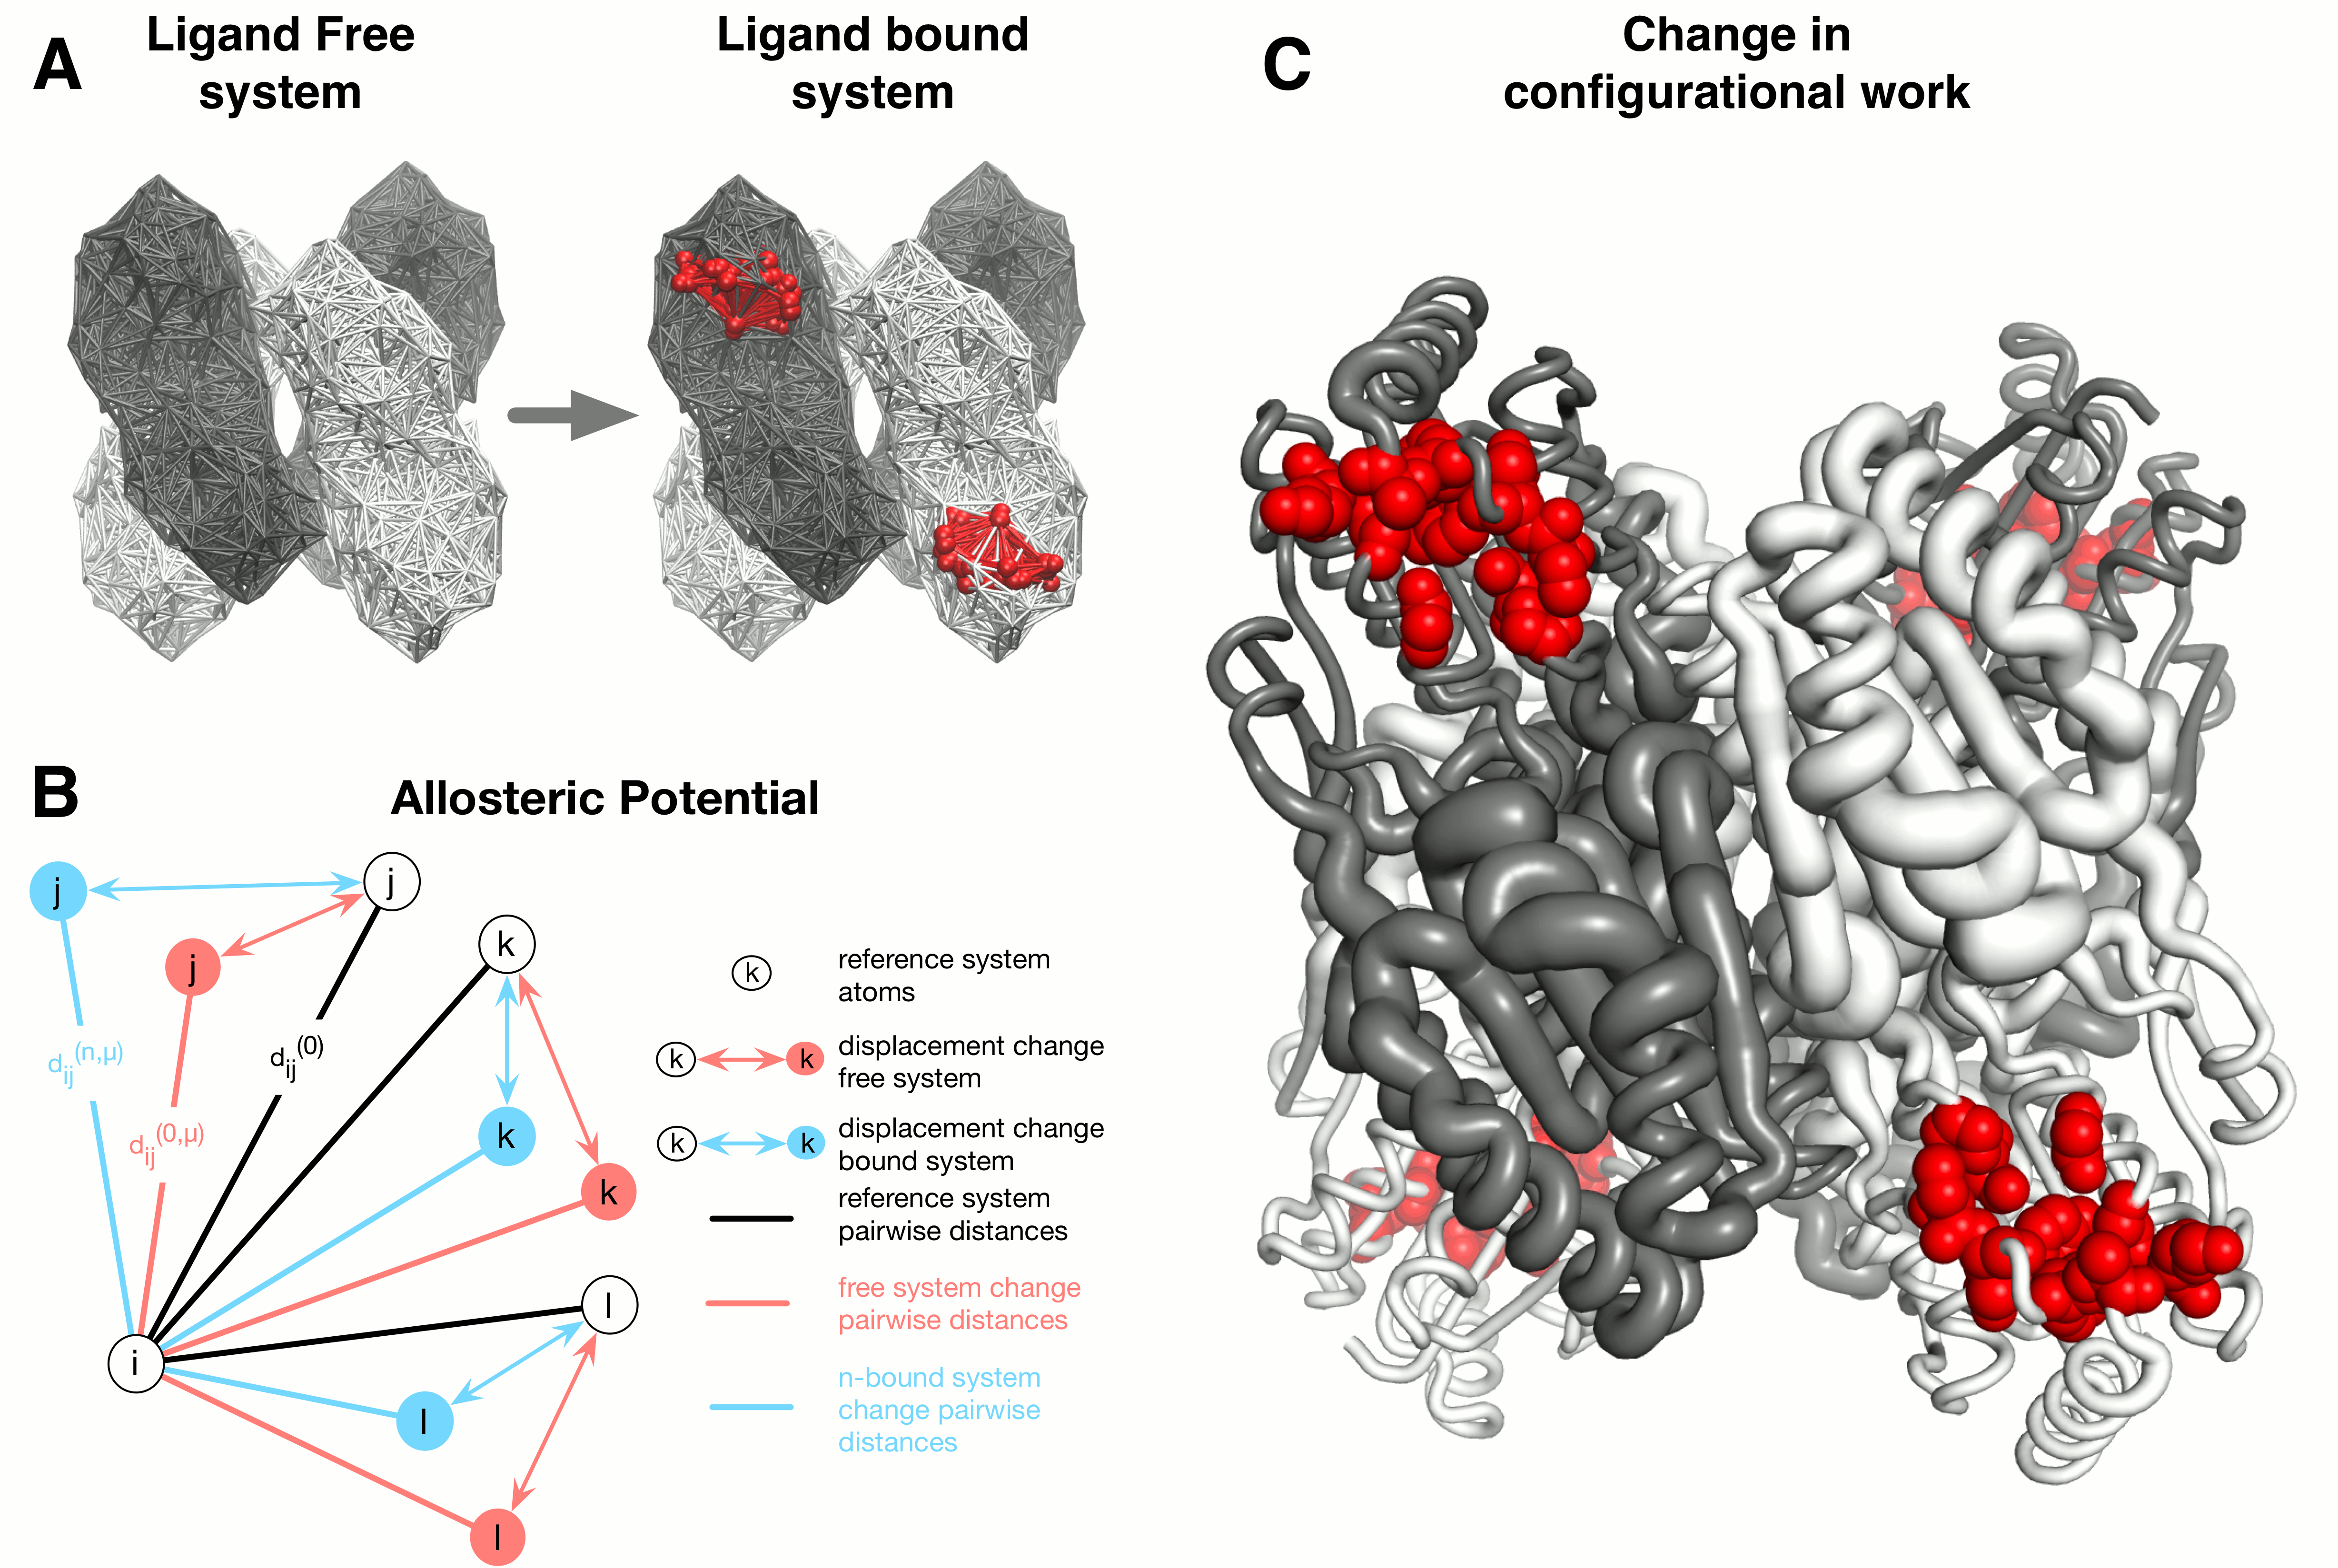
Within the context of the harmonic modeling of the
protein, binding is modeled via the harmonic
restraining of the residues that constitute the
binding site of interest. To this end, the binding of
an actual ligand is mimicked by increasing the
stiffness of contacts between the residues belonging
to the binding site. Thus, given a site (B) the
allosteric response caused by the effector binding on
a specific residue i is given by a free
energy difference
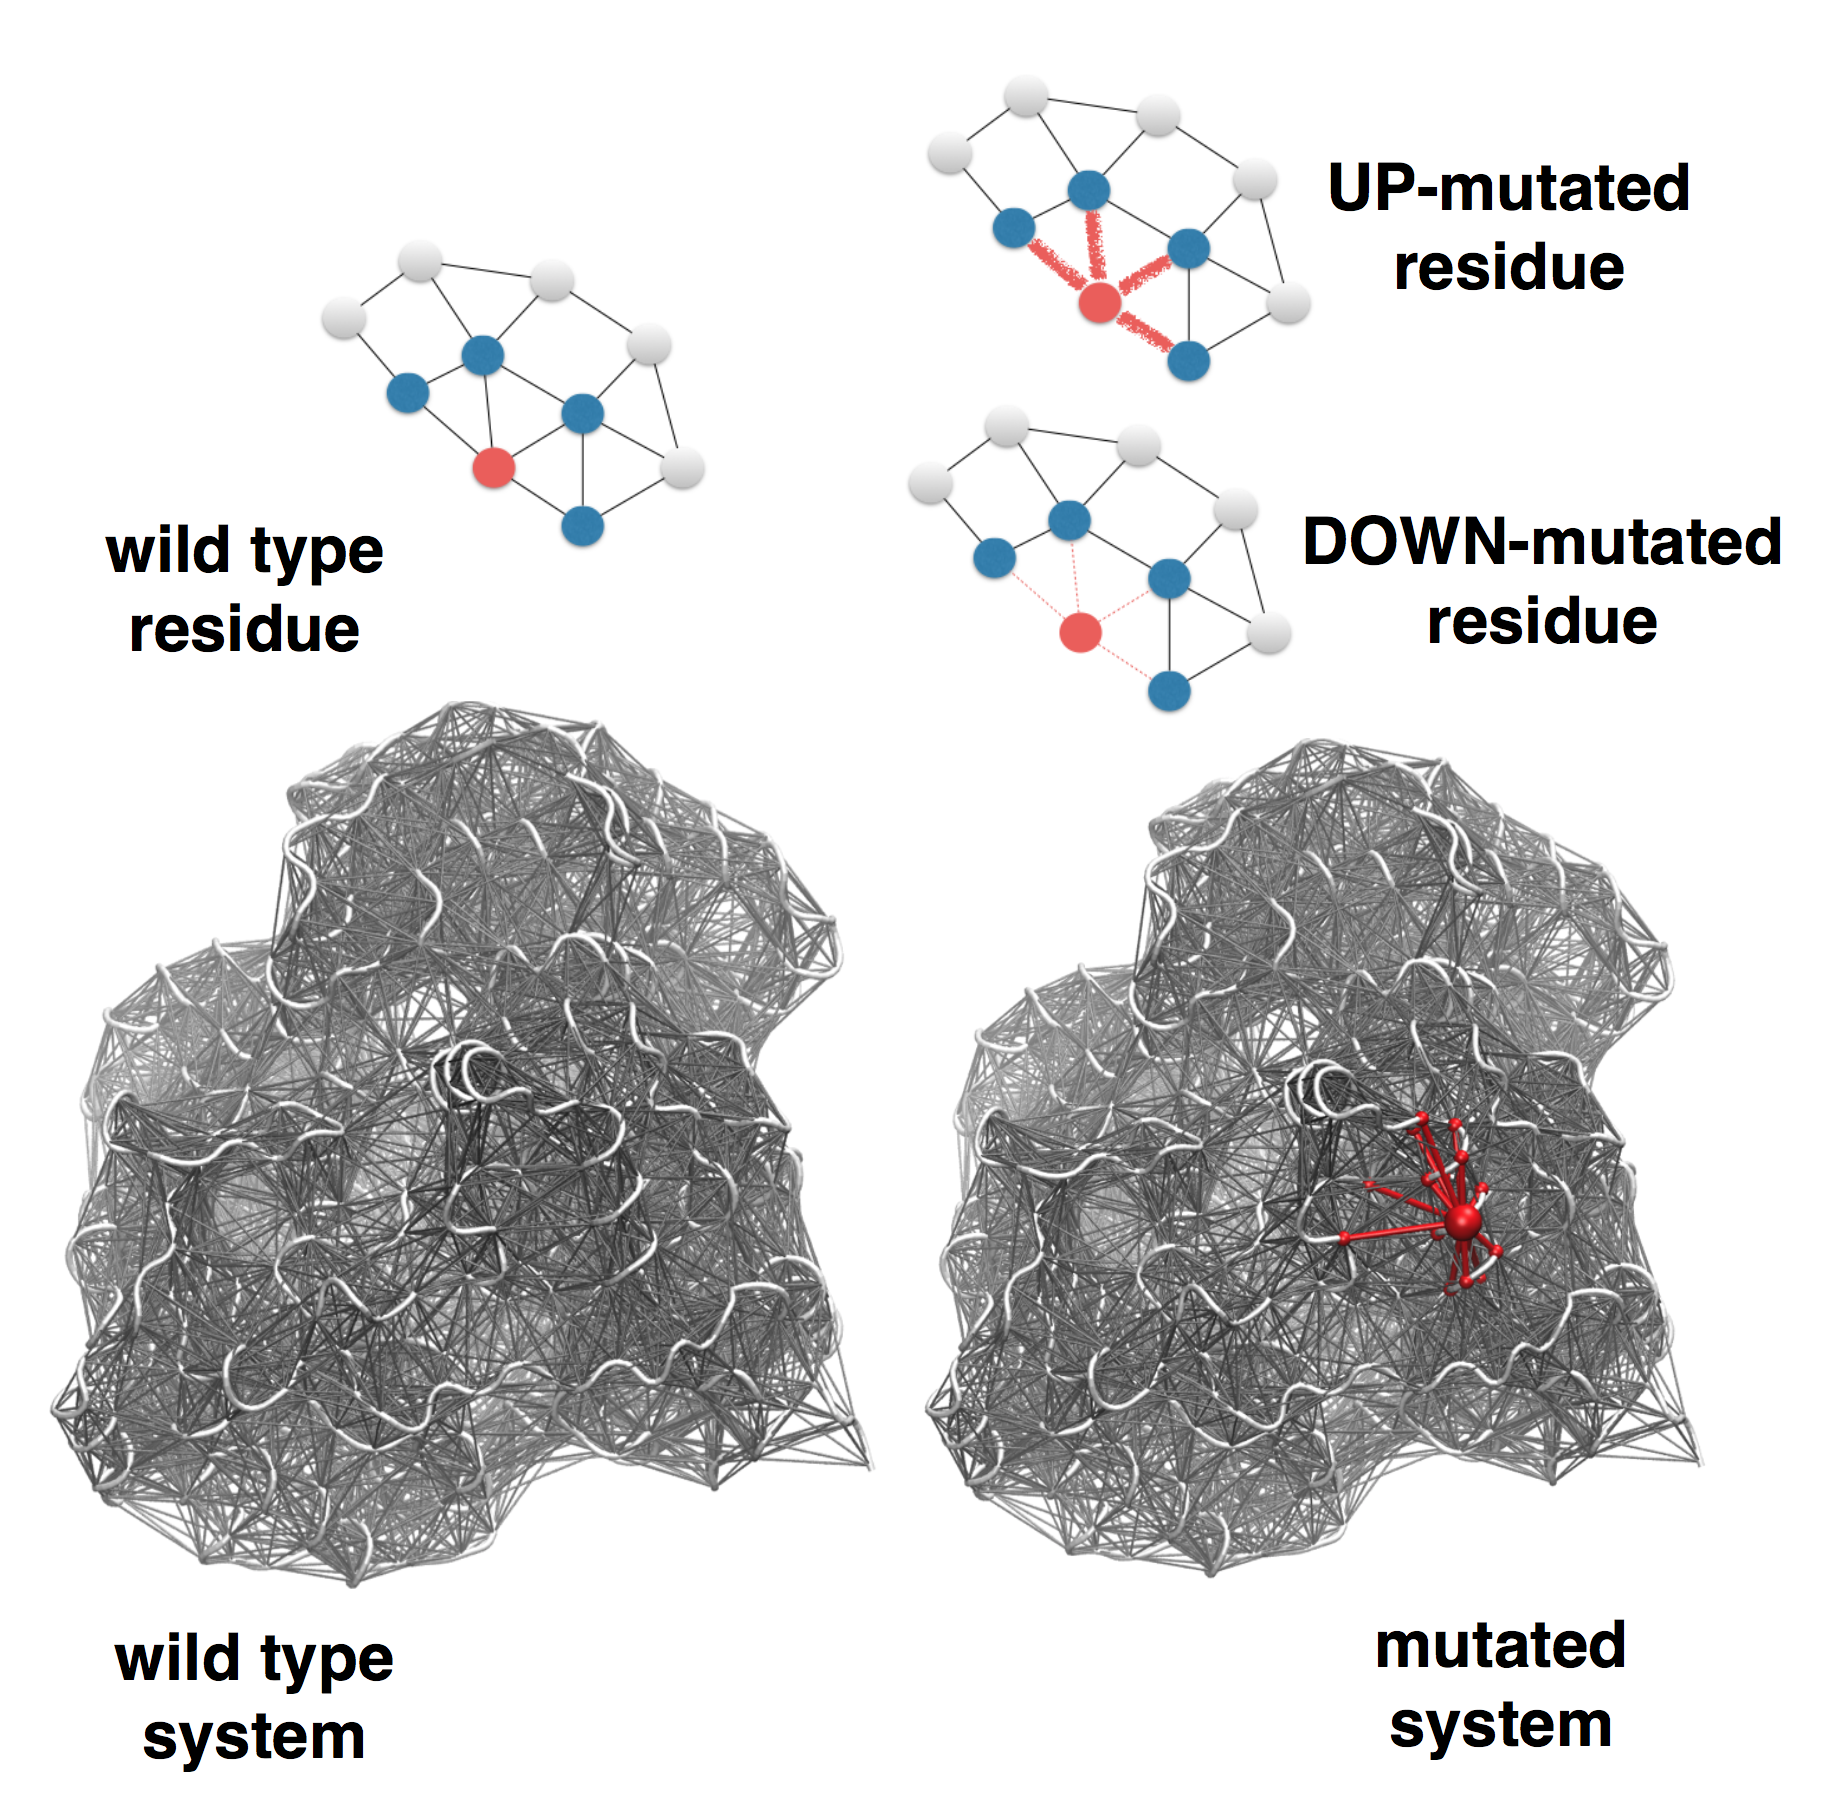
In the extension of the SBSMMA to
mutations, the effect of a mutation is modeled by
modifying the strength of the interactions in the
mutated residue's contact network. Two types of
mutations are defined, UP-mutations and DOWN-mutations
(see Figure 2). In the former the strength of the
interactions of the mutated residue is increased
(stiffening of the contact network), whereas decreased
in the latter (loosening of the contact network). The
rationale of the UP-mutation is to resemble a
residue replacement with a more bulky amino acid, as
opposite to the DOWN-mutation, which in turn
corresponds to small size amino acid replacements (for
example Ala/Gly). Thus, in case of a point mutation
(M) of a residue m the allosteric response on
a specific residue i is given by the free
energy differences
In the general case, the combined effect of binding and mutation (BM) perturbations, that is binding on a site (B) and mutation (M) of a residue m, is the result of a combined protein perturbed state, which is described by the energy function in Equation 2 of [3].
This tutorial guides the user through the functionality of AlloSigMA via several examples. The computational framework of the Server consists of several steps, some of them are optional depending on the problem the user is interested to address.
We recommend users to follow the steps prescribed below and not use back/forward buttons on the browser, as this may result in unexpected errors. Buttons for stepping back or aborting job submissions are provided on the server, below job details.
AlloSigMA is intended to be useful for researchers who are interested in a fast preliminary estimation of the allosteric effects associated with effector binding and/or mutations. As mentioned above, those researchers who are interested in mutations turning residues into bulkier ones should use the UP-mutation framework. On the contrary, if one is interested in Ala/Gly-like mutations, the DOWN-mutation option should be chosen.
In the following examples the tetrameric enzyme phosphofructokinase (PFK) is used. PFK is a textbook example of the allosteric regulation of protein function. In particular, the enzyme is allosterically inhibited by phosphoenolpyruvate (PEP) and activated by ADP binding to two overlapping binding sites. It is cooperatively regulated with respect to the binding of two substrates, fructose-6-phosphate (F6P) in the presence of PEP. The apo form (PDB ID 3pfk) was used here to perform the calculations.
Input Data
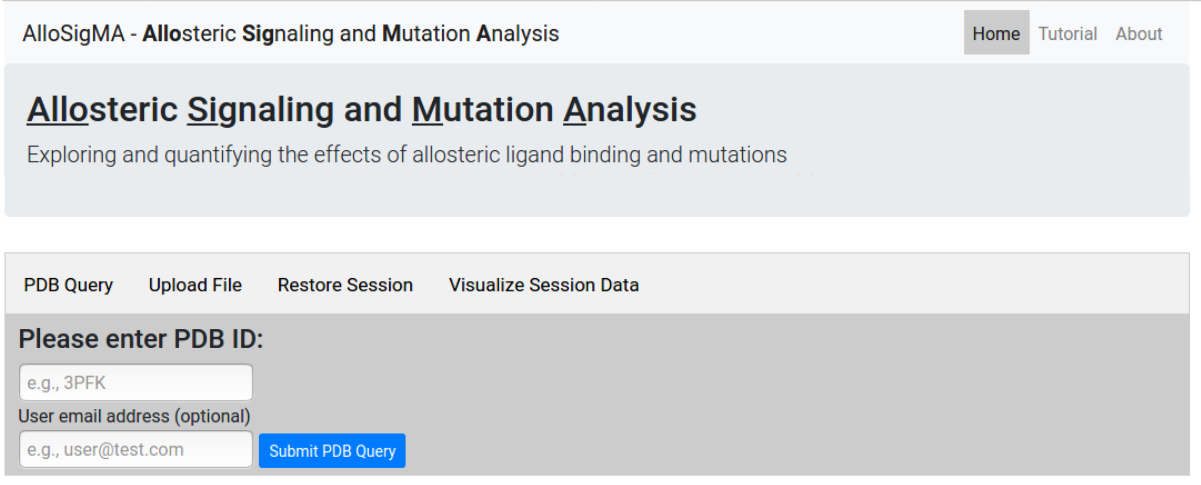
At the first step the user is asked to provide a PDB
ID for the protein of interest. Alternatively, the
user can upload a protein structure file in
pdb format
(Figure 3). Users may provide an email address to receive
a notification when the job completes. From this page one
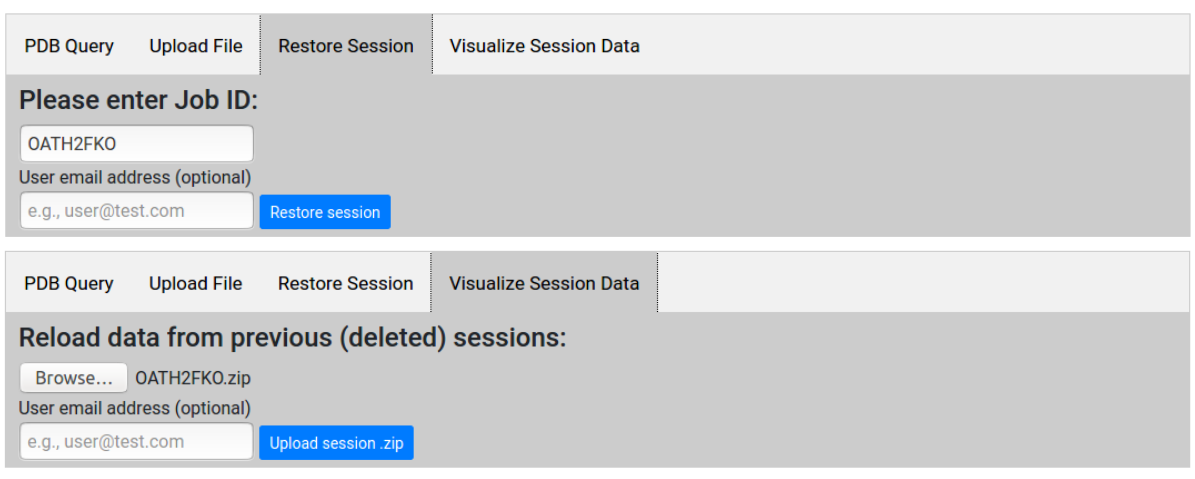
can also restore a previous session
from the job ID or visualize
the data associated with the session.
Biological assemblies and homologs
First, the server connects to EBI PISA database and uses the best matching assembly that corresponds to the PDB ID entered by the user. The complete and ordered list of PISA assemblies, according to the solvation energy gain upon assembly, allows the user to choose the assembly of interest (See Figure 4 for the corresponding screenshot). By clicking on the headers of each column in the list, the explanation of the corresponding parameters will appear in a popup window. For the specifics of how to choose the most correct biological assemble we refer the user to the PDBePISA original tutorial. Typically, the top line in the PISA output gives the biological assembly. As a next step, the list of the first 10 best matching homologs (99% sequence identity) is generated from the VAST server. The list of homologs is used to extract a set of binding sites that can be used for the analysis of the effects of ligand binding. Using structural alignment the binding sites are mapped to the corresponding chains of the considered protein structure. A Job ID is also assigned to the current process.
Due to file formatting constraints, the system is able to process only up to a maximum of 40 chains (as defined in the structure file): selecting assemblies or uploading structure files with more than 40 chains may result in unexpected errors.
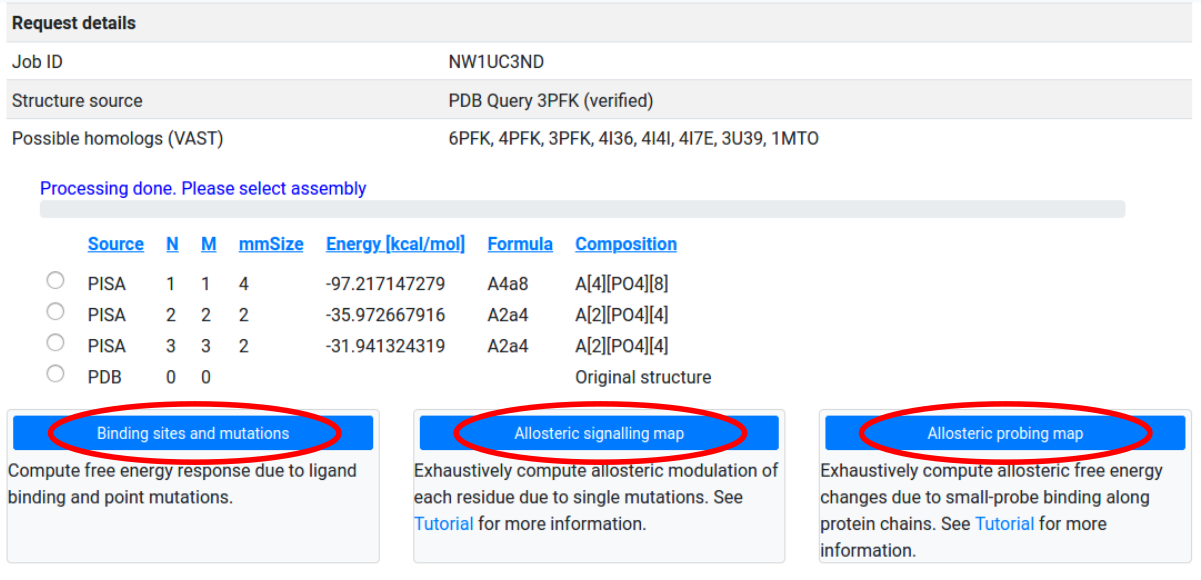
After selecting an assembly for study, users may choose between three modes of operation:
- Binding sites and mutations: Perform a single computation of the free energy response to specified ligand binding, mutations, and their combinations.
- Allosteric signaling map: Compute the free energy response to the mutation of single residues along selected protein chains.
- Allosteric probing map: Compute the free energy response to the binding of small probes along selected protein chains.
Binding sites and mutations
The first mode of operation enables users to perform a single computation of the free energy response of each residue to ligand binding and/or mutations.
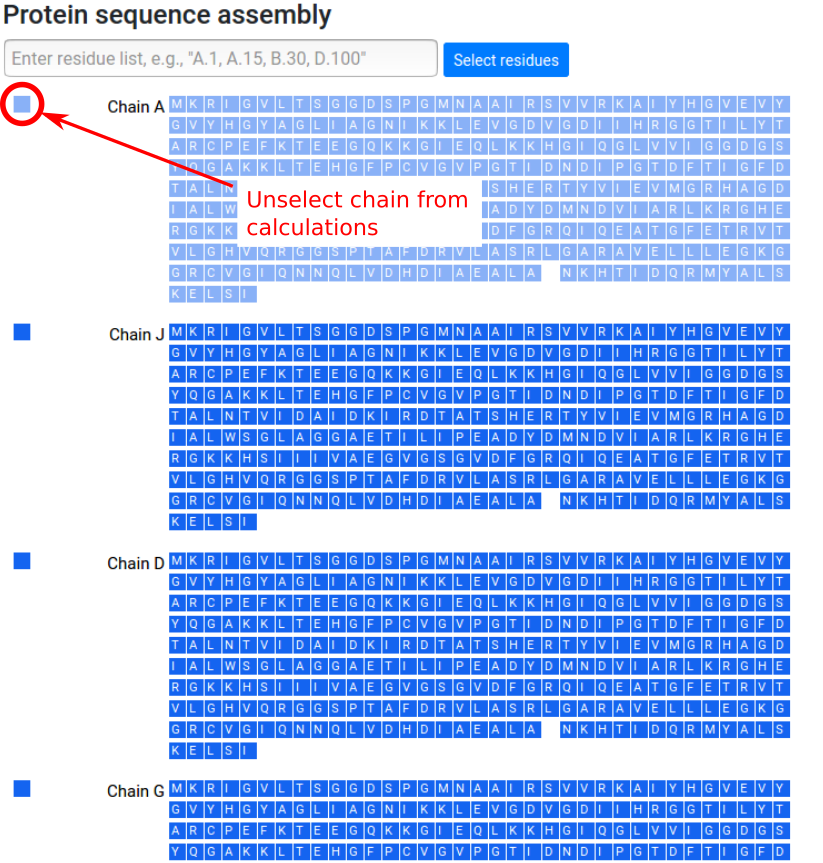
Protein chains and binding sites
Once the protein assembly is chosen by the user, a panel with the protein chains and protein residues is provided on the left side of the page. Chains can be entirely selected to be excluded from the calculation (Figure 5). In case of discontinuities in the protein sequence, that is missing fragments or residues, a blank space is shown in the sequence at the positions corresponding to the missing residues.
Due to memory constraints, the server can only process structures with up to 5,000 protein residues. Users studying larger structures would be required to select a subset of chains to be excluded from the computation.
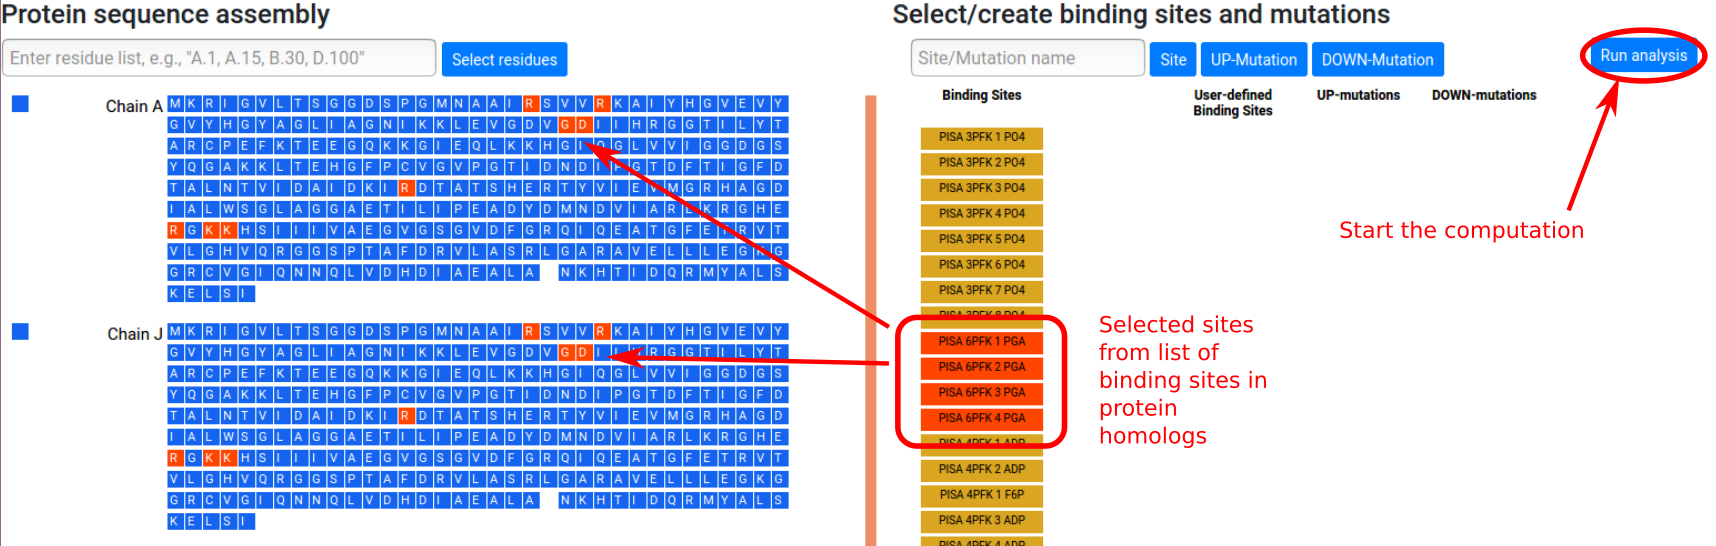
The list of retrieved binding sites is shown in the
right panel. Sites can be selected to be considered in
the calculation by clicking the corresponding buttons,
which will turn red. The corresponding residues will
turn red in the sequence panel. Figure 6 shows the
situation in which four binding sites PGA are selected
from the available list. The calculations for the
allosteric free energy caused by binding at the PGA
effector sites can be started by clicking the "Run
analysis" button. Users that have provided an email address will receive notifications when job submission is successful and when the job has completed.
Usage tip: Analysis of large proteins may take a while. Users may exit the browser and return to check analysis results at a later time by referencing the Job ID (and email, if provided), through the Restore Session function.
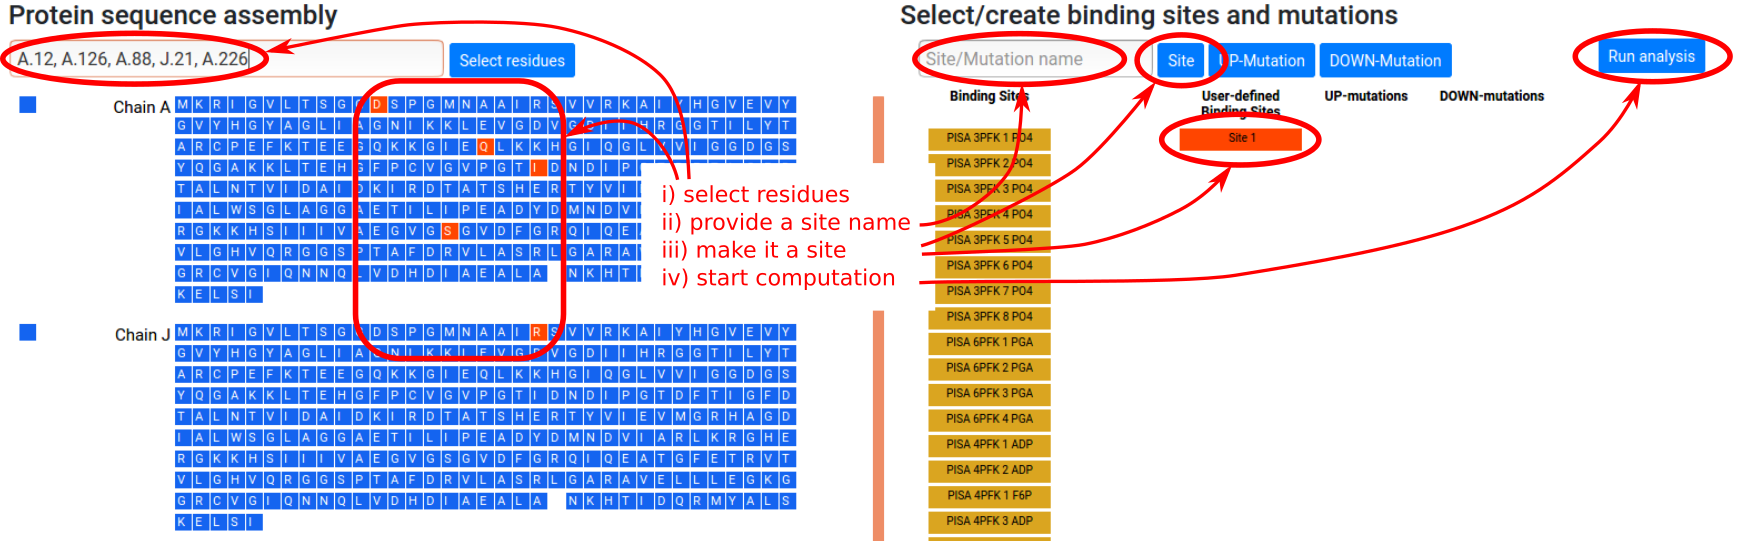
User designated binding sites
Besides the available binding sites obtained from homologs, the user can manually define binding sites of interest according to the following procedure (see Figure 7):
- Select residues of interest in the left sequence panel, either by entering a string of chains and residue positions, or by clicking on individual residues.
- Type in the name of the site in the “Site/Mutation name” form in the right panel (optional).
- Click the “Site” button in the right panel. This
will turn it red and select the site for
calculation. The corresponding residues will be
turned red in the left sequence panel. Note that
clicking again on the newly added red button will
deactivate it, so that the site will not be used in
the calculation.
- Click "Run analysis" button to perform the
calculations.
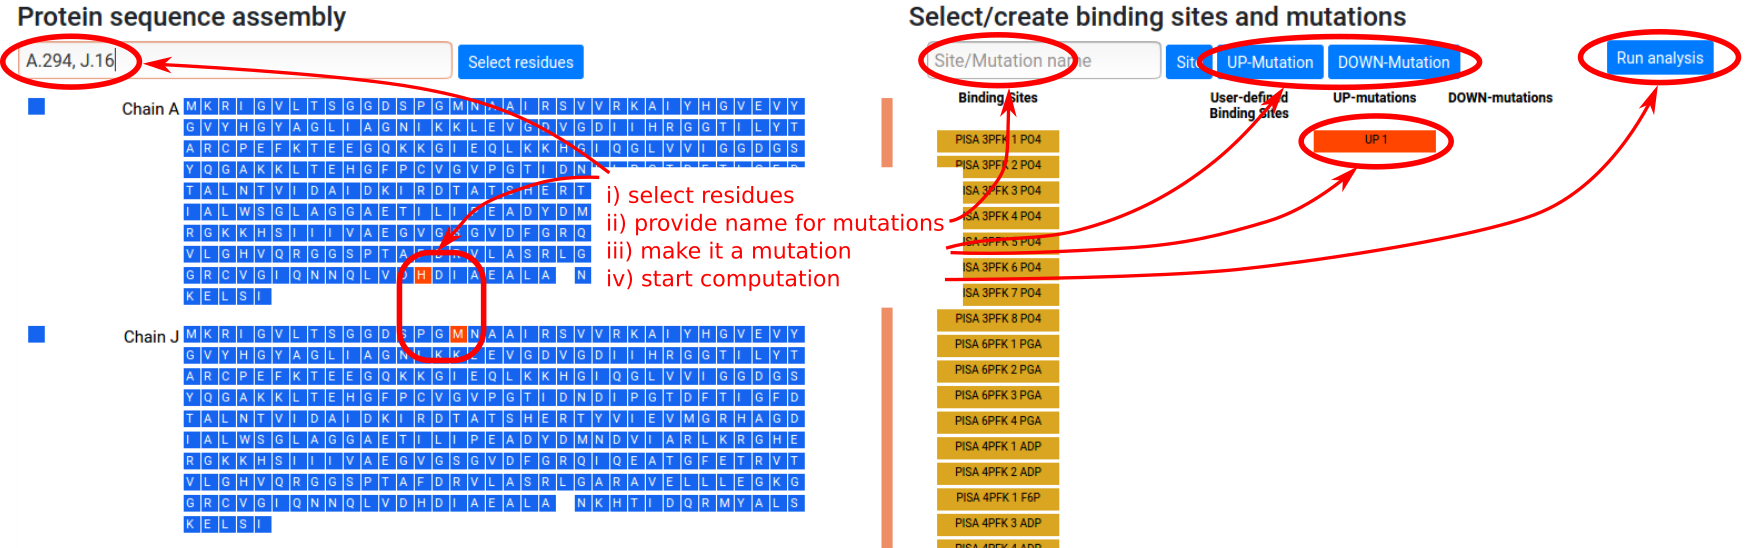
User designated mutations
Mutations can be defined in a similar way to the previously shown binding site assigment procedure. Let us consider a single point UP- or DOWN-mutation (see Figure 8). The procedure is:
- Select residues to be mutated in the left sequence panel, by entering a string of chains and residue loci or by clicking on the residues directly (multiple mutations are allowed).
- Type in the name of the mutation or the list of mutations in the “Site/Mutation name” form in the right panel (optional).
- Click the “UP-Mutation” button for UP-mutations or “DOWN-Mutation” for DOWN-mutations. This will add a red button with the name of the mutation set and the corresponding residues will be turned red in the left sequence panel. Note that clicking again on the newly added red button will deactivate it, so that mutations will not be used in the calculation.
- Click "Run analysis" button to perform the calculations.
Note: In the following, we will illustrate how to navigate the Results page for different modes of operation with a few examples, and users may restore and view these examples using the corresponding Job IDs using the Restore Session tab on the main page, leaving the email field empty.
Example: Binding at PGA site in PFK
We illustrate now the results for the binding at the PGA site on the 3pfk structure (Job ID PZTDWRW2). The PGA ligand is an analog of the ADP activator. The PGA binding sites were retrieved from the 6pfk structure as a result of the homolog search and binding site extraction. Four binding sites are considered
- PISA 6PFK 1 PGA
- PISA 6PFK 2 PGA
- PISA 6PFK 3 PGA
- PISA 6PFK 4 PGA
Clicking on the binding sites buttons will turn them red as well as the corresponding residues in the left sequence panel (see Figure 6).
By clicking the “Run analysis” button will start the calculation of the allosteric free energy per residue as a result of the modeled binding at the above binding sites.
The calculation should take a few minutes, at the end of which a new page is shown (see Figure 9).
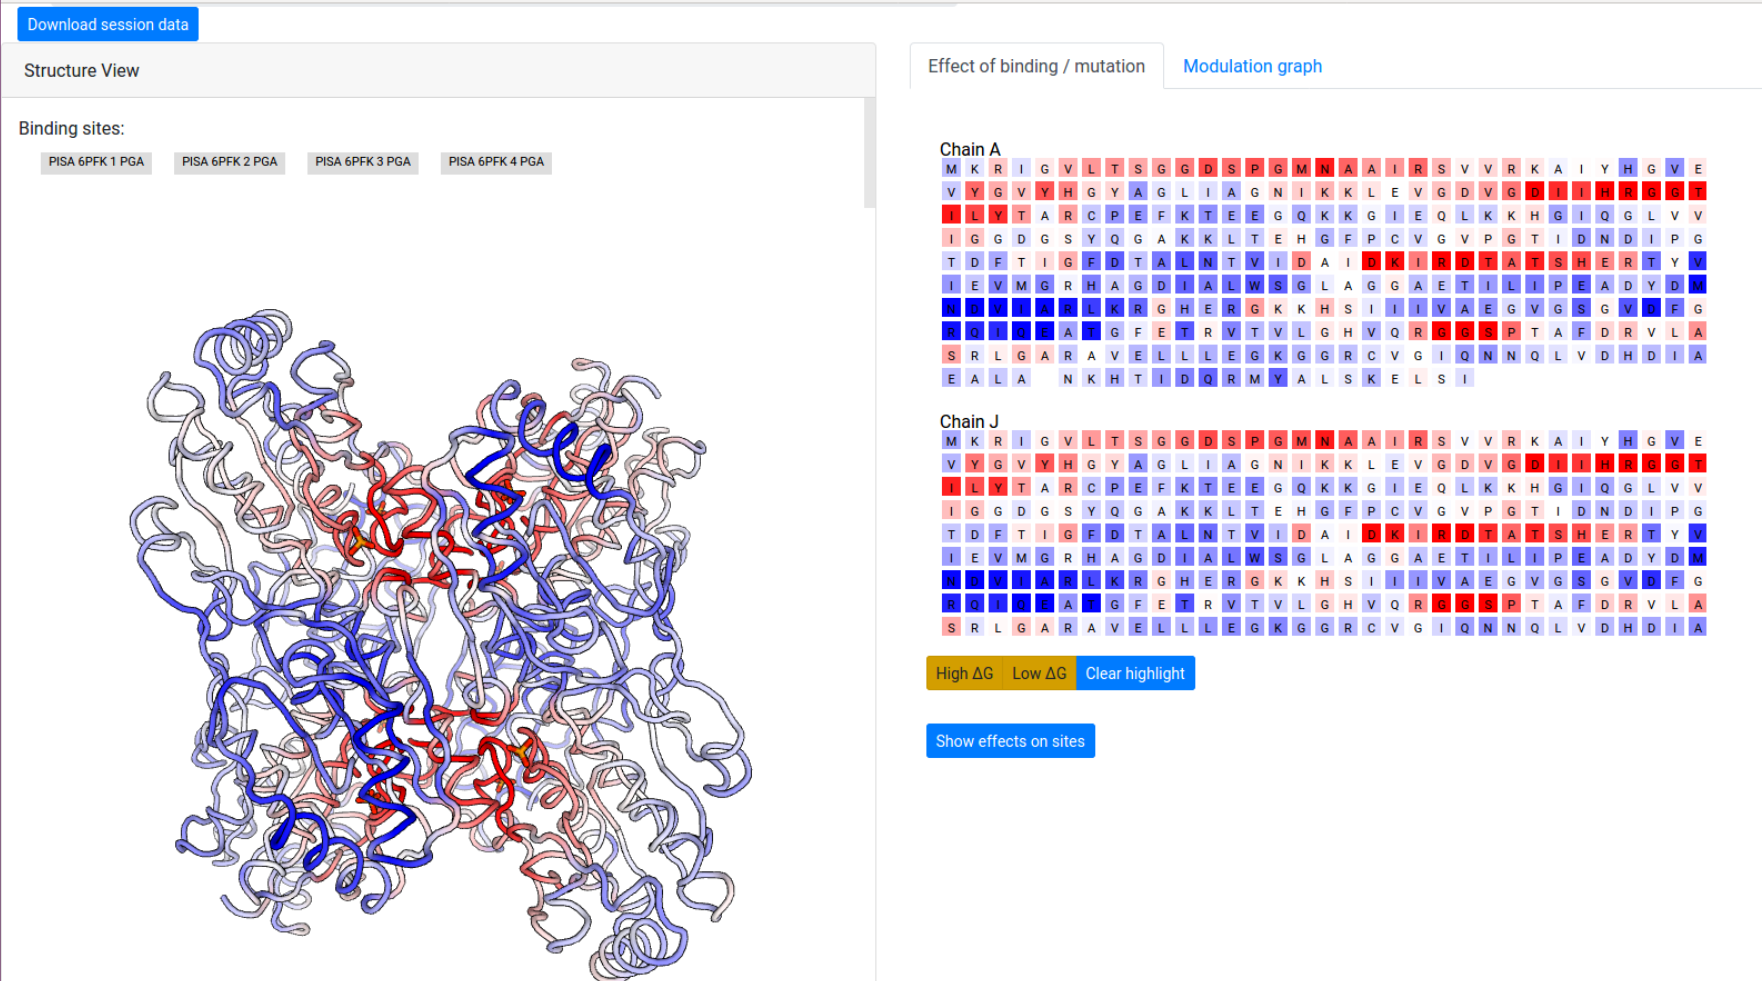
The computation result is displayed in two panels, with the left panel showing the results on the 3D spatial model, and the right panel displaying results on the protein chains and sequences.
The “Structure View” panel (Fig 9, left) lists the bound effector sites, and shows the protein with chains rendered efficiently as an interpolated tube using PV colored according to the per-residue allosteric free energy values Δgi. The allosteric free energy is the difference in work exerted on residue i between ligand-bound and ligang-free protein states. A Red-White-Blue color map is used to illustrate the energy values: Blue color (positive Δgi) indicates enhanced conformational changes, red color (negative) indicates suppresed conformational changes upon effector binding. White-colored residues have their dynamics mostly unaffected by effector binding.
Grey buttons above the structure act as controls to display the bound effector sites: pointing the mouse over the buttons highlight the bound residues as grey spheres on the structure, while clicking on the buttons highlight the bound residues on the sequence panel on the right, under the “Effect of binding / mutation” tab.
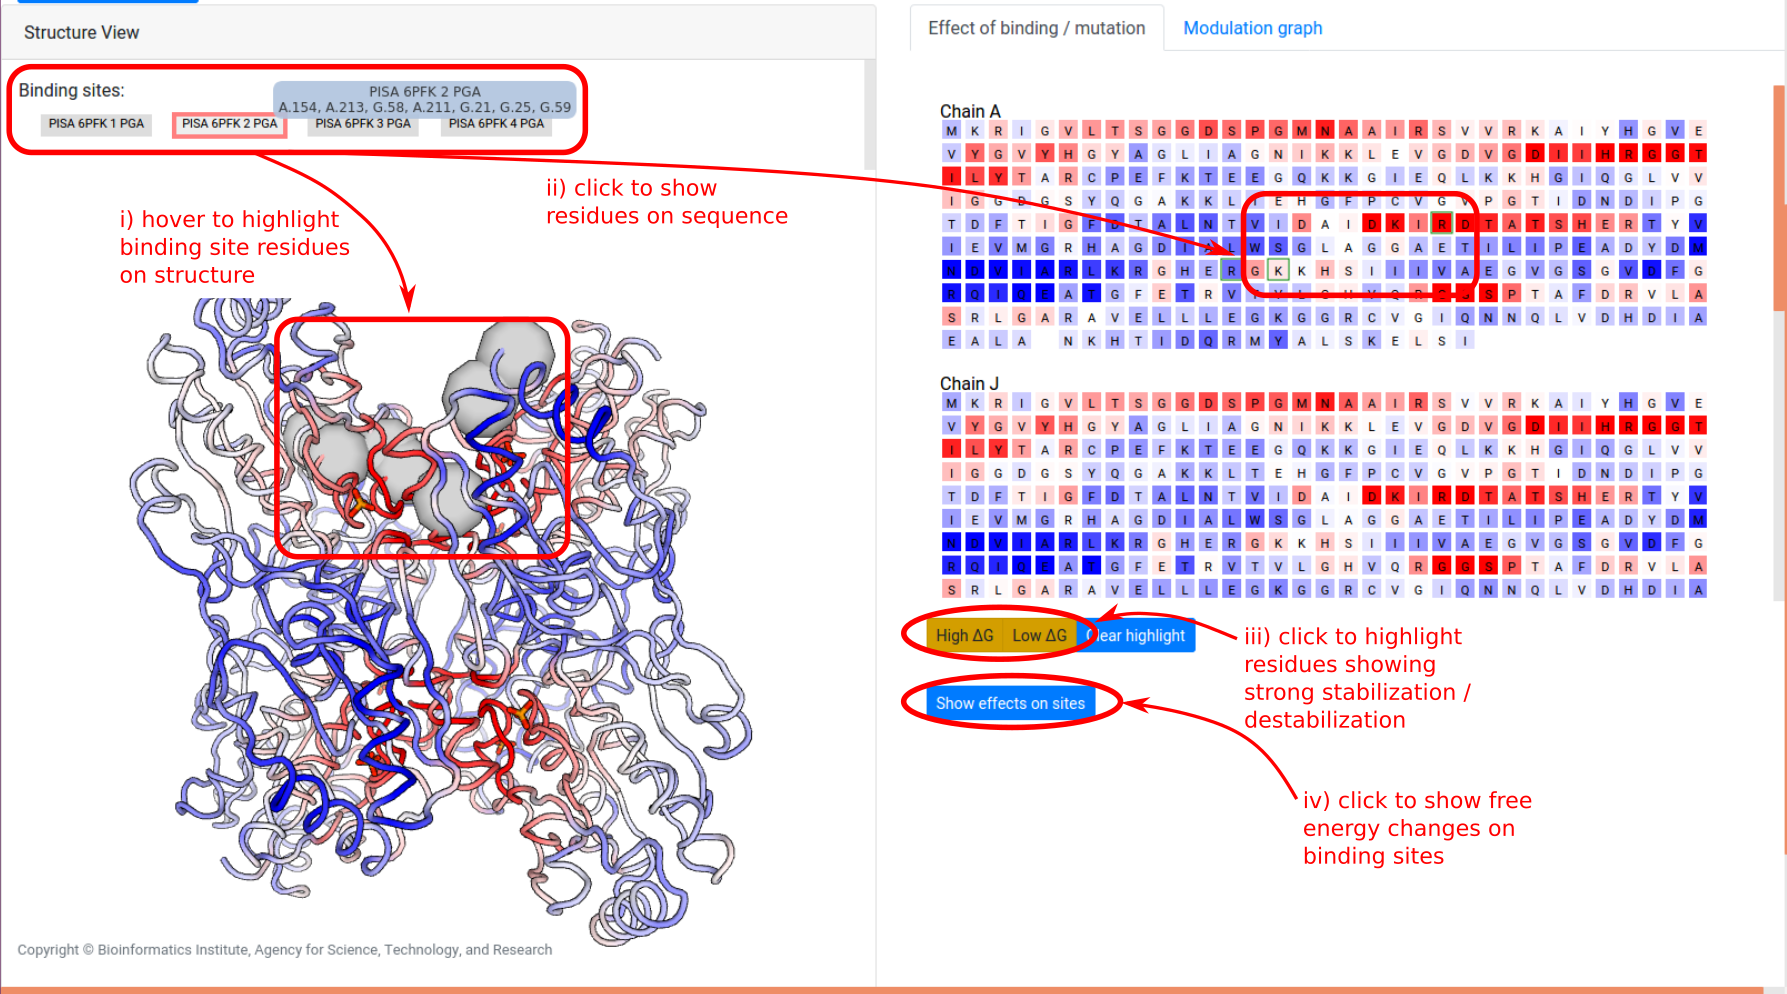
The right panel is divided into two tabs:
- Effect of binding / mutation: Protein chains and residues are shown, colored according to the allosteric free energy values. Pointing the mouse over a residue allows the user to see the corresponding free energy value in kcal/mol. Residues that show a strong conformational changes (high Δg) or constraining (low Δg) can be highlighted using the yellow buttons below the sequences, and the overall free energy change in the selected binding sites can be obtained by clicking “Show effects on sites” at the bottom of the panel.
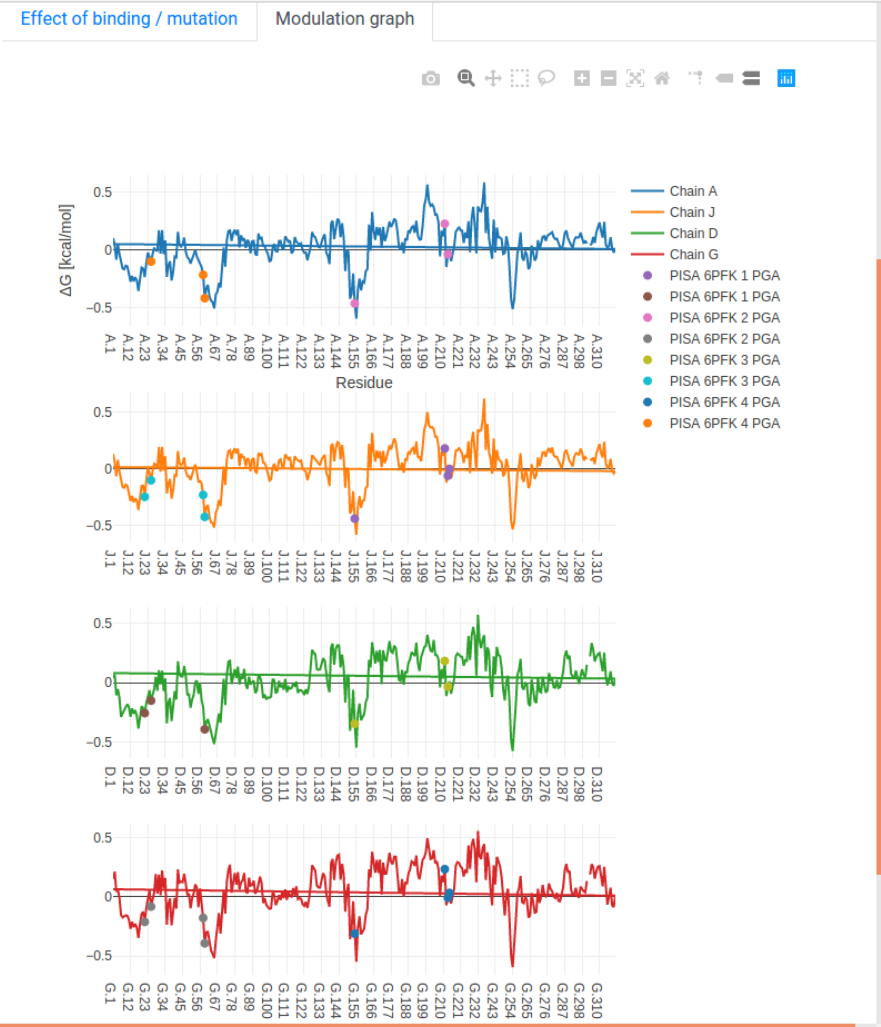
- Modulation graph: The free energy change is shown on a linear graph along the protein sequence, using the Plotly package. Bound sites and mutations are annotated on the graph for convenience. Interactive exploration of the data can be performed using standard tools provided in Plotly.
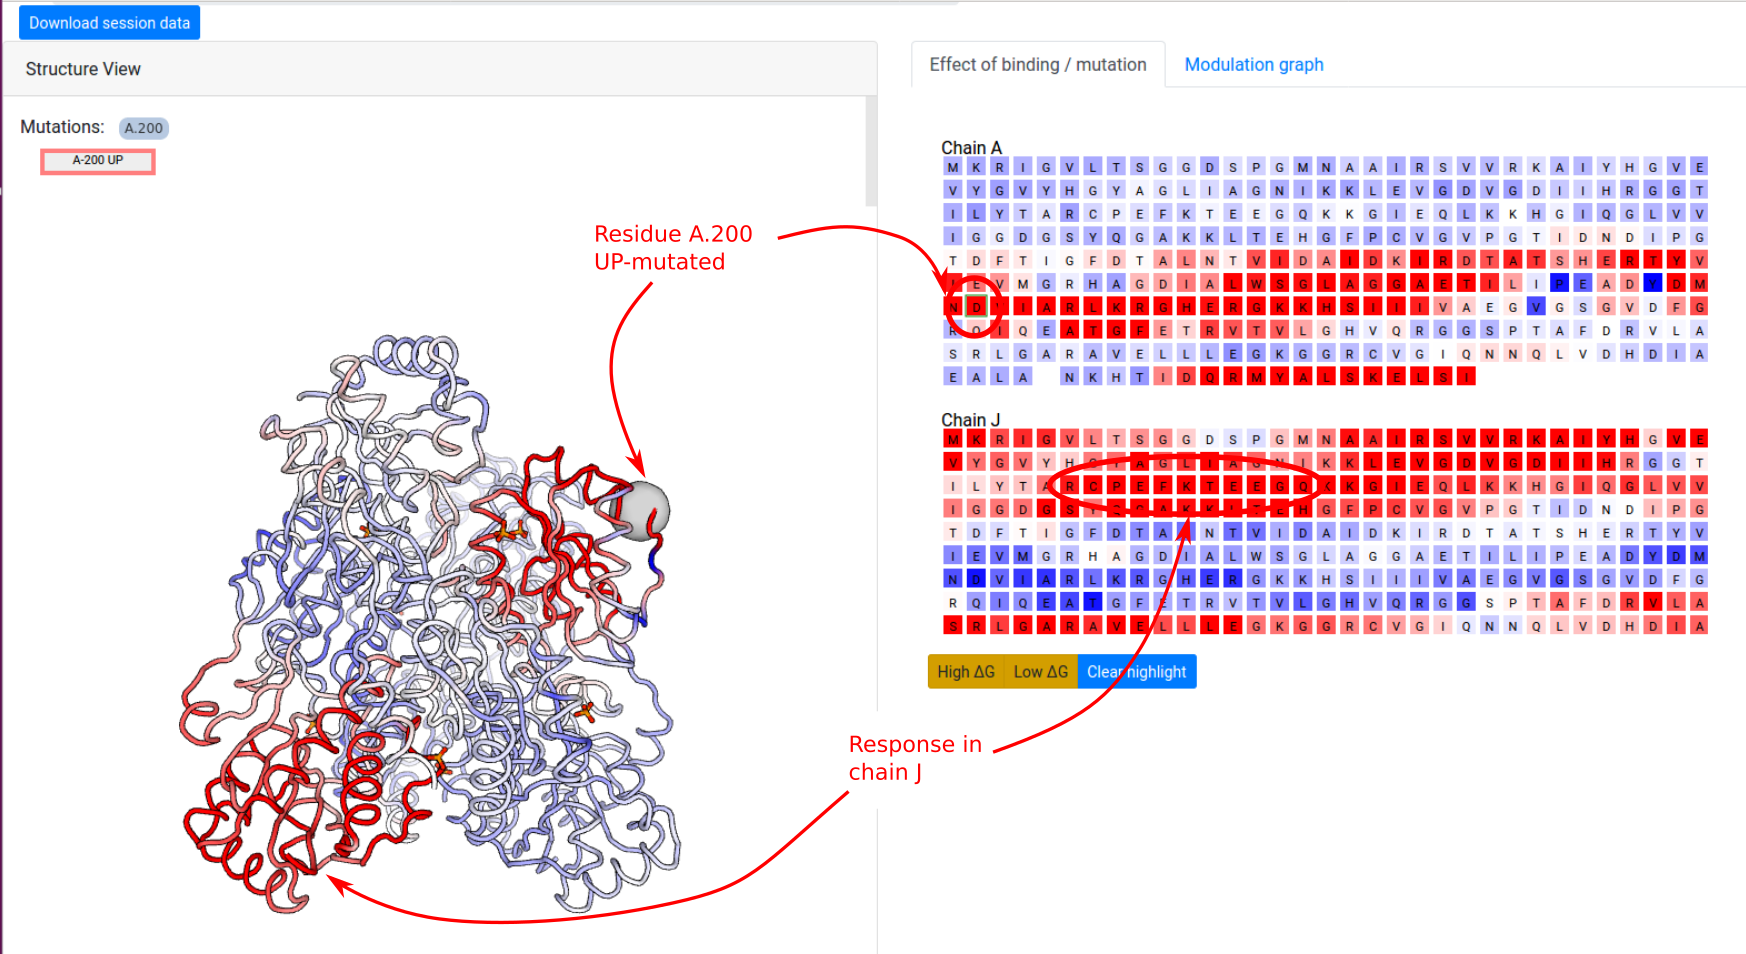
Example: Point mutations in PFK
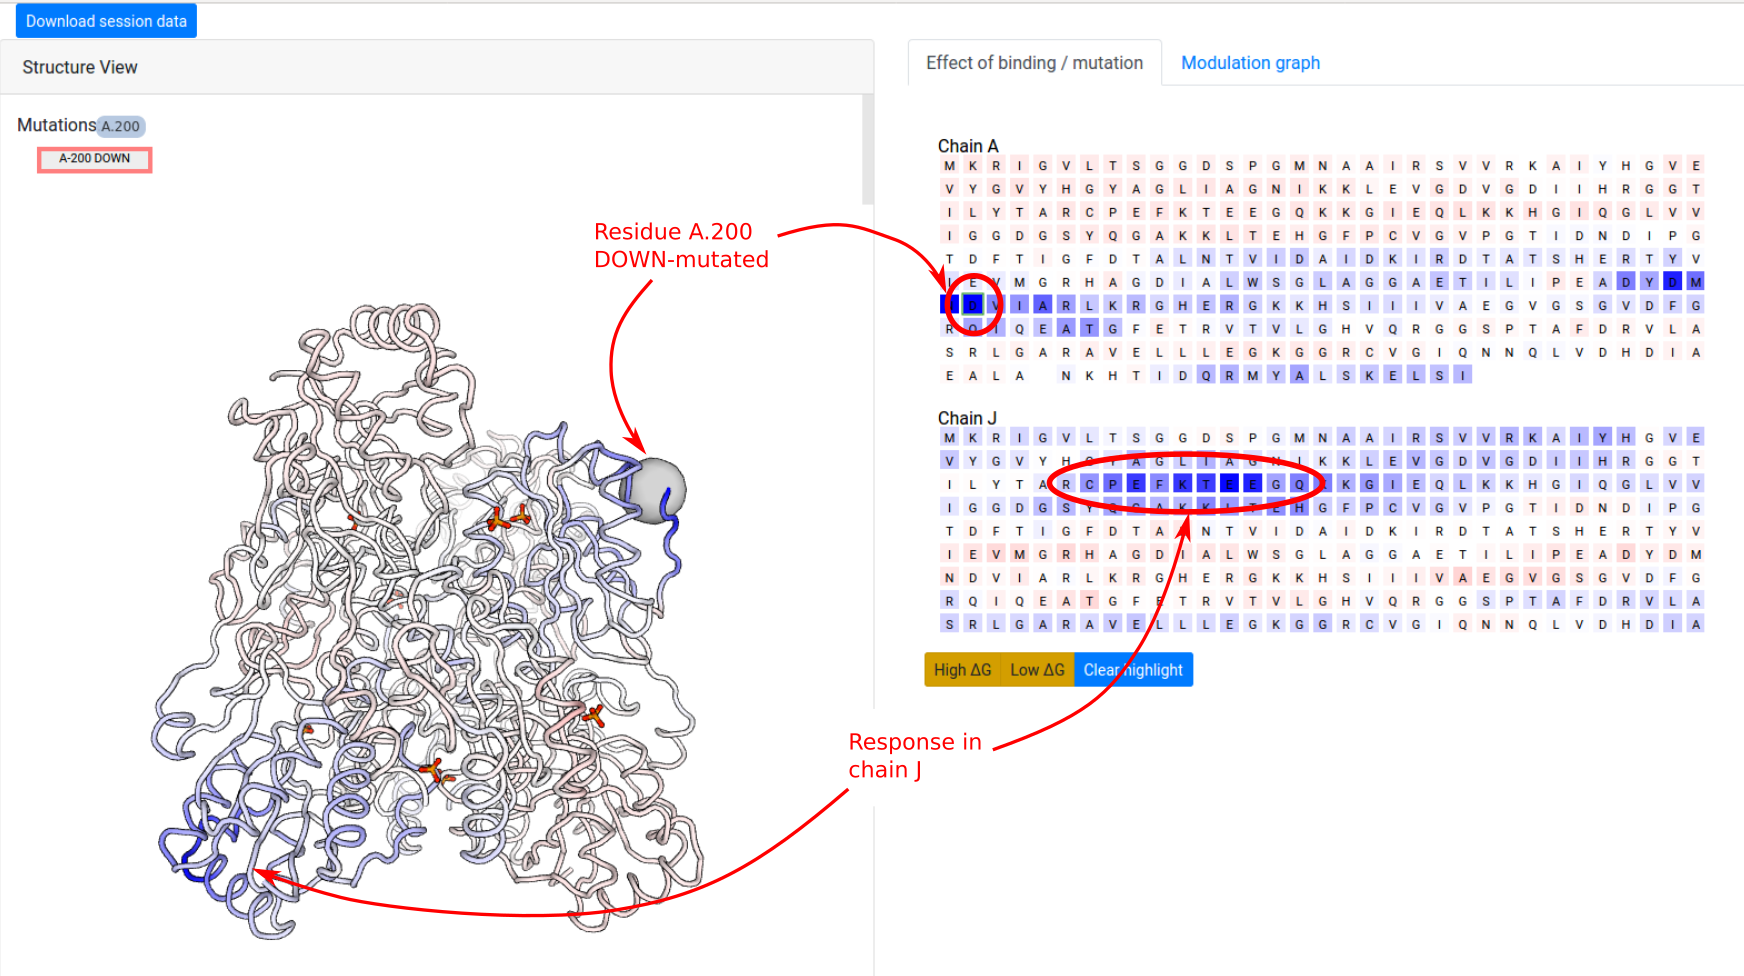
In the next example, we show how to investigate the effect of a point mutation on the PFK energetics. The definition of UP-/DOWN-mutations is outlined in the Mutations section. We first consider a point UP-mutation at residue 200 in the chain A (Job ID 1178LD5U). Recall that an UP-mutation corresponds to the tightening of the contact network of the mutated residue. As a result, the UP-mutation A.200 produces a local stabilization of a part of the distant chain J (residues 70-80) and slightly affects the dynamics the other chains (Figure 12). In the results page, similar visualization options are available as in the case of ligand binding.
DOWN-mutation of residue 200 of the chain A
(Job ID ALOK1AD4) produces
the opposite effect to that of the corresponding
UP-mutation, that is the destabilization of the
network of residues in contact with the mutated one as
well as the destabilization of the residues 70-80 of
chain J. A DOWN-mutation
corresponds to the loosening of the contact network of
the mutated residue, i.e. it models the mutation of
the residue to small size amino acids such as Ala/Gly
(see Figure 13).
Scanning modes: Allosteric signalling and probing maps
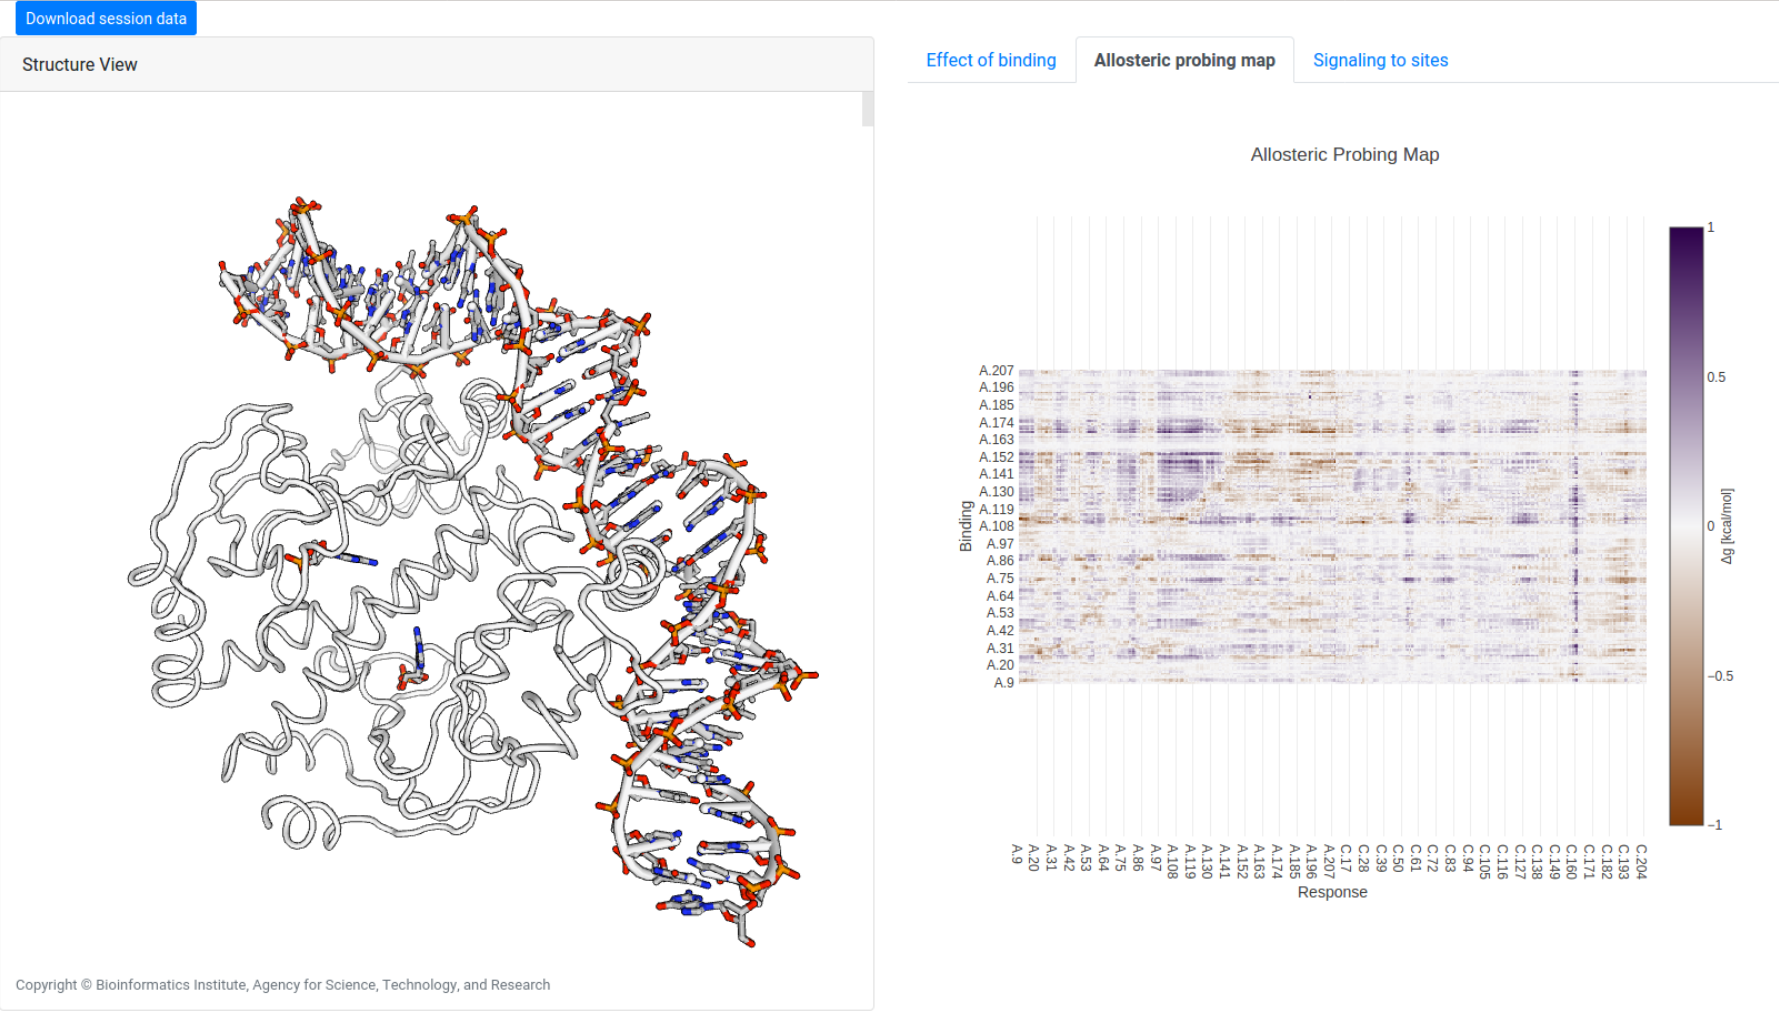
To enable the exhaustive study of allosteric signalling between different protein regions, we have included two scanning modes for computing the per-residue free energy response to simulated mutation and small-probe binding events occurring at all residues. First, the mode “Allosteric signalling map” (ASM) enables users to determine the free energy response to single UP/DOWN mutations, as well as allosteric signaling from residues as expressed by the modulation range, scanning through each residue to produce a 2D allosteric signalling map. Second, the mode “Allosteric probing map” (APM) enables users to determine the free energy response to small probes binding to three consecutive residues along the protein chain, scanning through all such triplets.
Protein chain selection
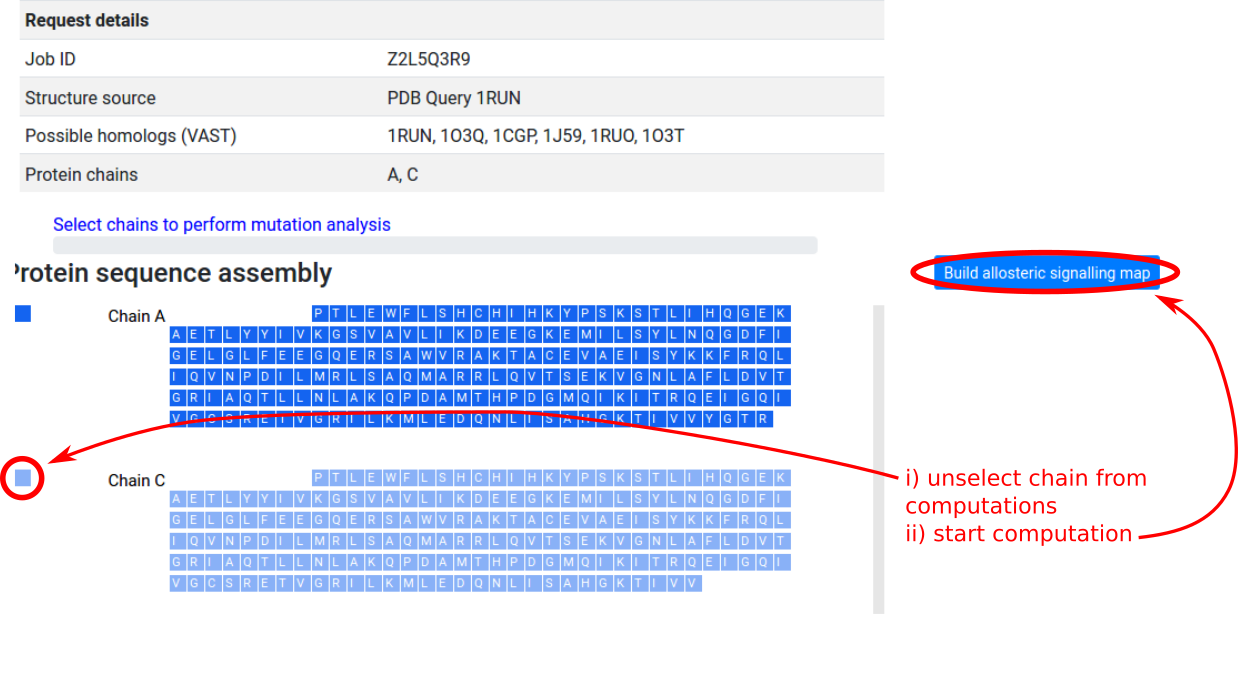
As in the “Binding sites and mutations” mode, upon selecting the protein assembly a panel with the protein chains and protein residues is provided on the left side of the page. In the case of symmetric proteins, users may save computational time by excluding one or more chains from the mutation scanning operation. In Figure 14, CAP (1RUN) is a homodimer with symmetric chains A and C, and unselecting chain C enables the server to scan through mutations on chain A only, while computing the free energy response on both chains at each round. Once the selection is complete, clicking the “Build allosteric signalling / probing map” button will submit the job to the server.
Due to memory constraints, the server can only process structures with up to 2,000 protein residues. Users will receive an email notification when the job submission is successful, and when the job has been completed. See Benchmarks for a guide on the time required for computation (not including job queueing time).
Example: Allosteric effect of single-residue mutations in CAP
We show how the allosteric signalling map (ASM) is visualized on the results page, using the example of CAP (1RUN) scanning through mutations on chain A. The left panel shows the protein structure in a white tube representation, along with ligands in the PDB file. The right panel begins at the “Allosteric signalling map” tab, showing the “modulation range”
which characterizes how significantly mutations on residue i affect the dynamics of a responding residue j. The data is visualized as a heatmap using Plotly. Pointing the mouse over the pixels shows the identity of both mutated and responding residues, highlighting them on the structure on the left panel.
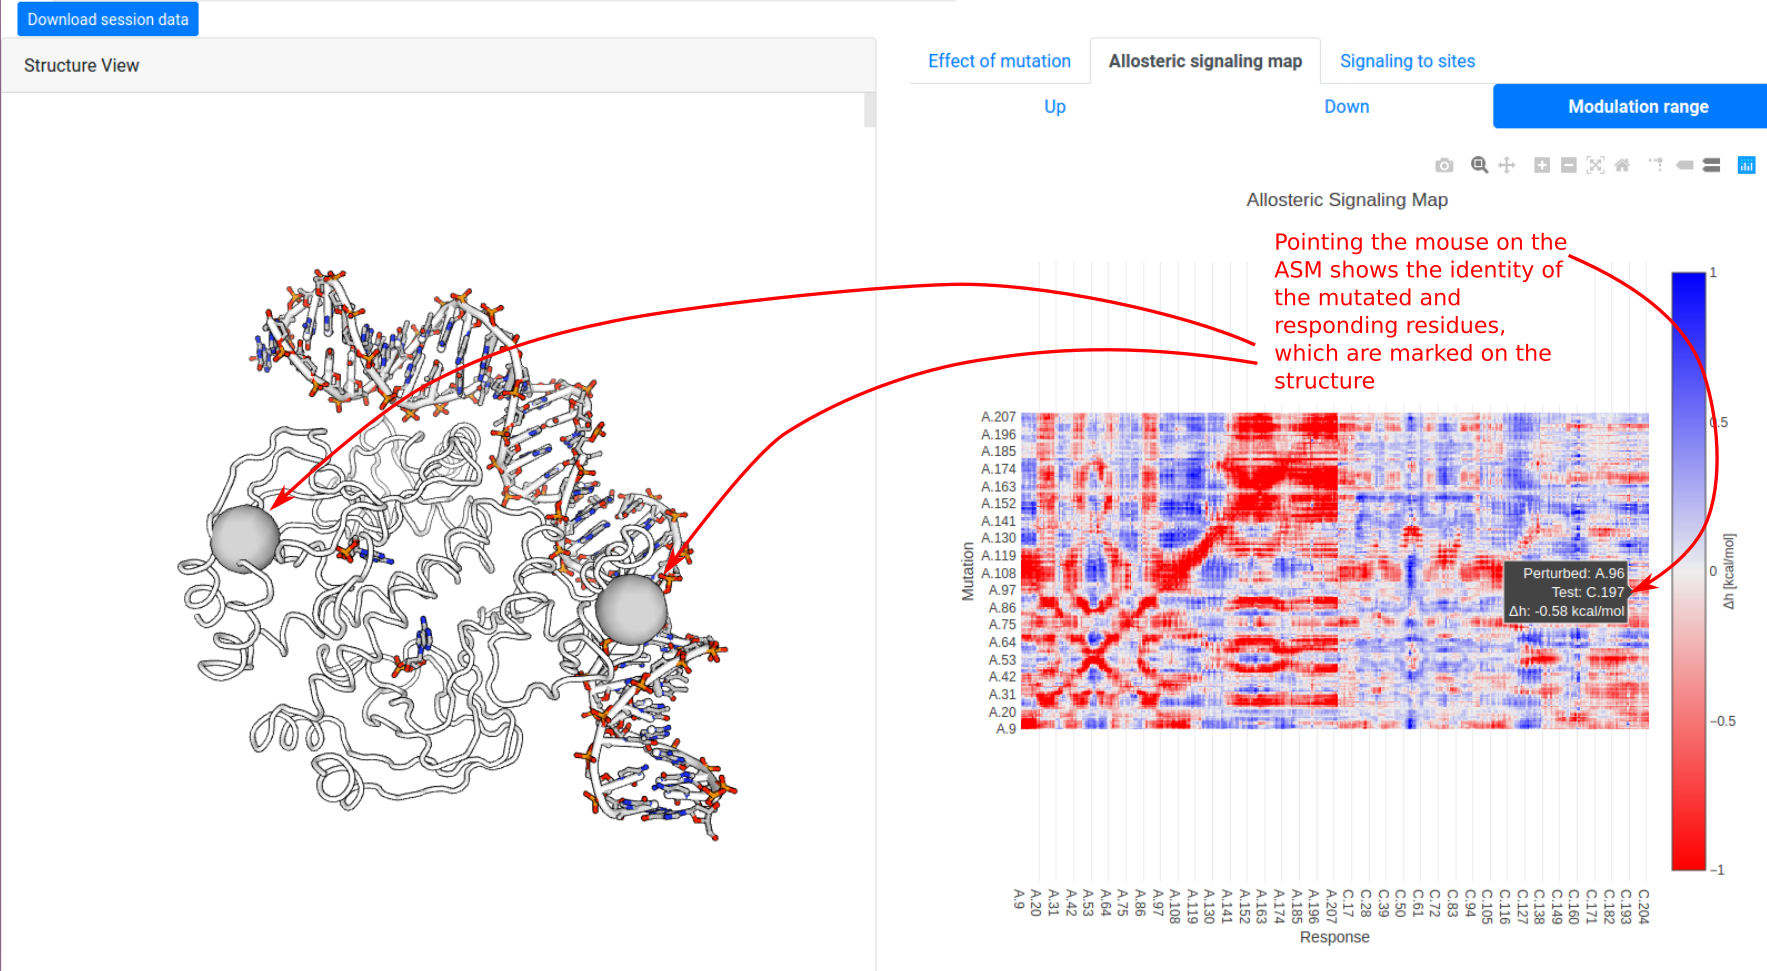
Users may click on the “Up / Down / Modulation range” buttons in the panel to toggle between ΔgUP, ΔgDOWN, and Δh, respectively. (Note that scanning matrix data for large structures may take a long time to load.)
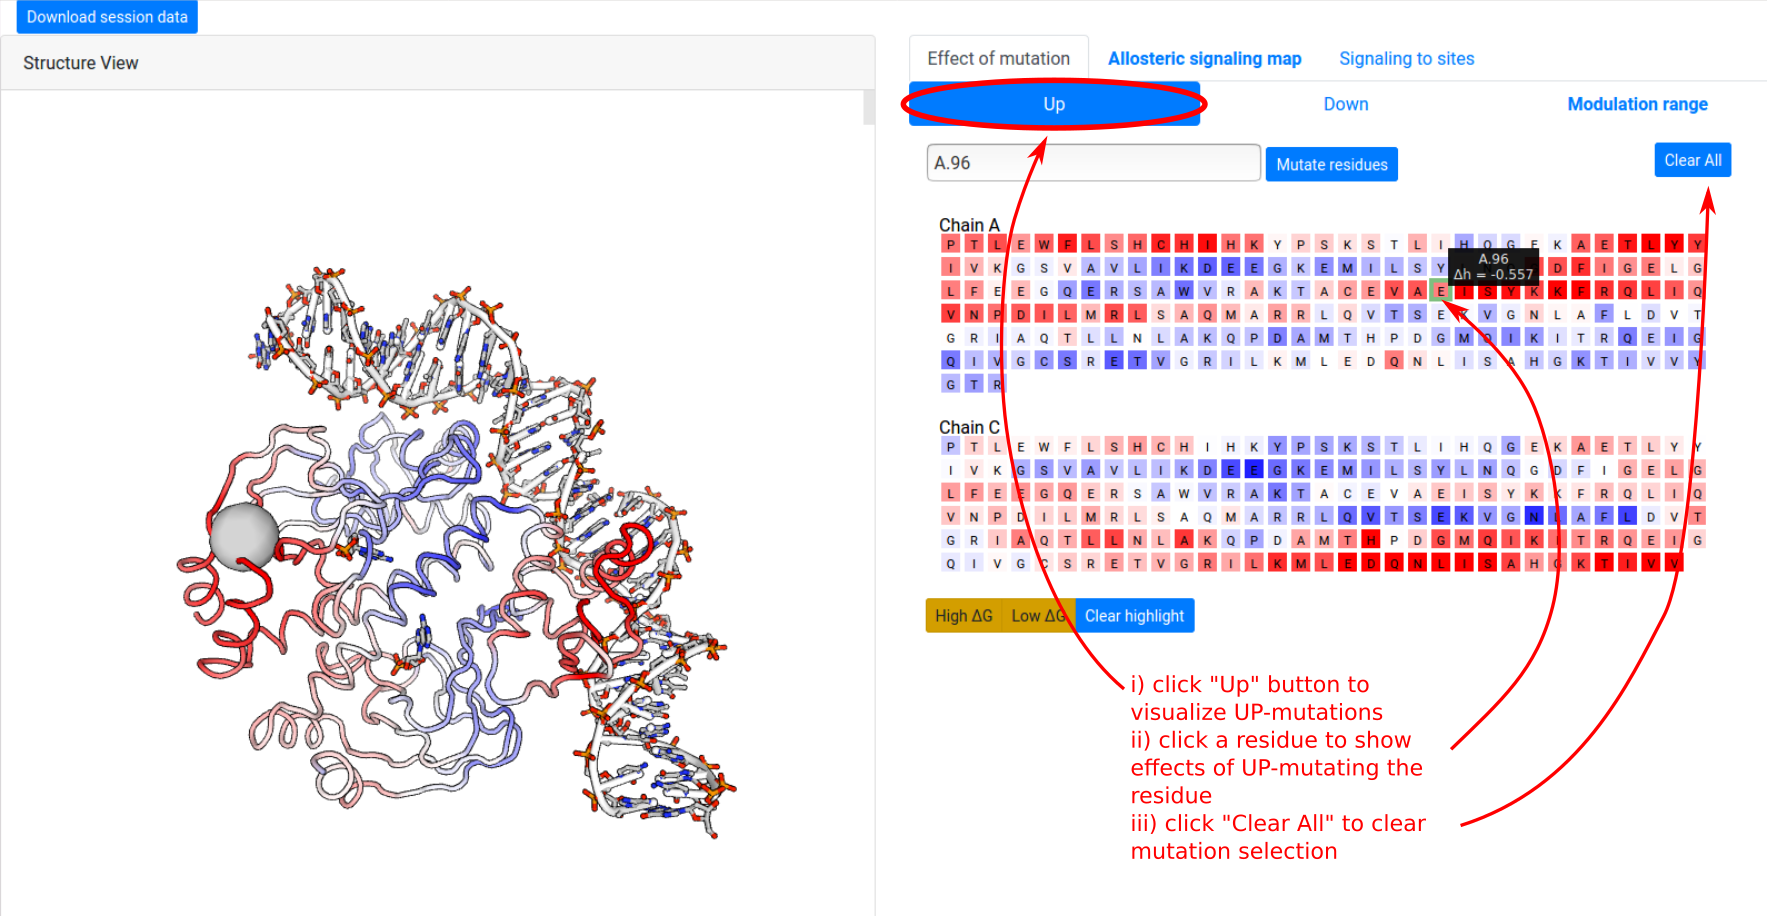
The ”Effects of mutations” tab shows the protein sequence, and enables users to visualize the effects of single mutations on free energy response across the whole protein. To visualize the effect of UP mutation on A.96:
- click the “Up” button at the top of the panel. This switches to visualizing ΔgUP.
- click on the residue A.96 shows the free energy response corresponding to an UP mutation of A.96, on both the left “Structure View” panel and the right sequence panel.
Individual mutations may be selected and deselected by clicking on the residues in the sequence panel, and the combined effect of multiple mutations may be estimated by selecting multiple residues at once. The Clear button resets the mutation selection.
Finally, to identify residues where mutations significantly alter the dynamics of user-designated binding sites, the “Signalling to sites” tab allows users to define sites of interest. To show the free energy change ⟨ΔgUP⟩site on a site due to UP mutations:
- click on the “Up” at the top of the panel
- provide the list of bound residues and a name (alphanumeric, spaces, and hyphens only)
- click on the “Add site” button. This creates a grey button representing the new site
- click on the site button
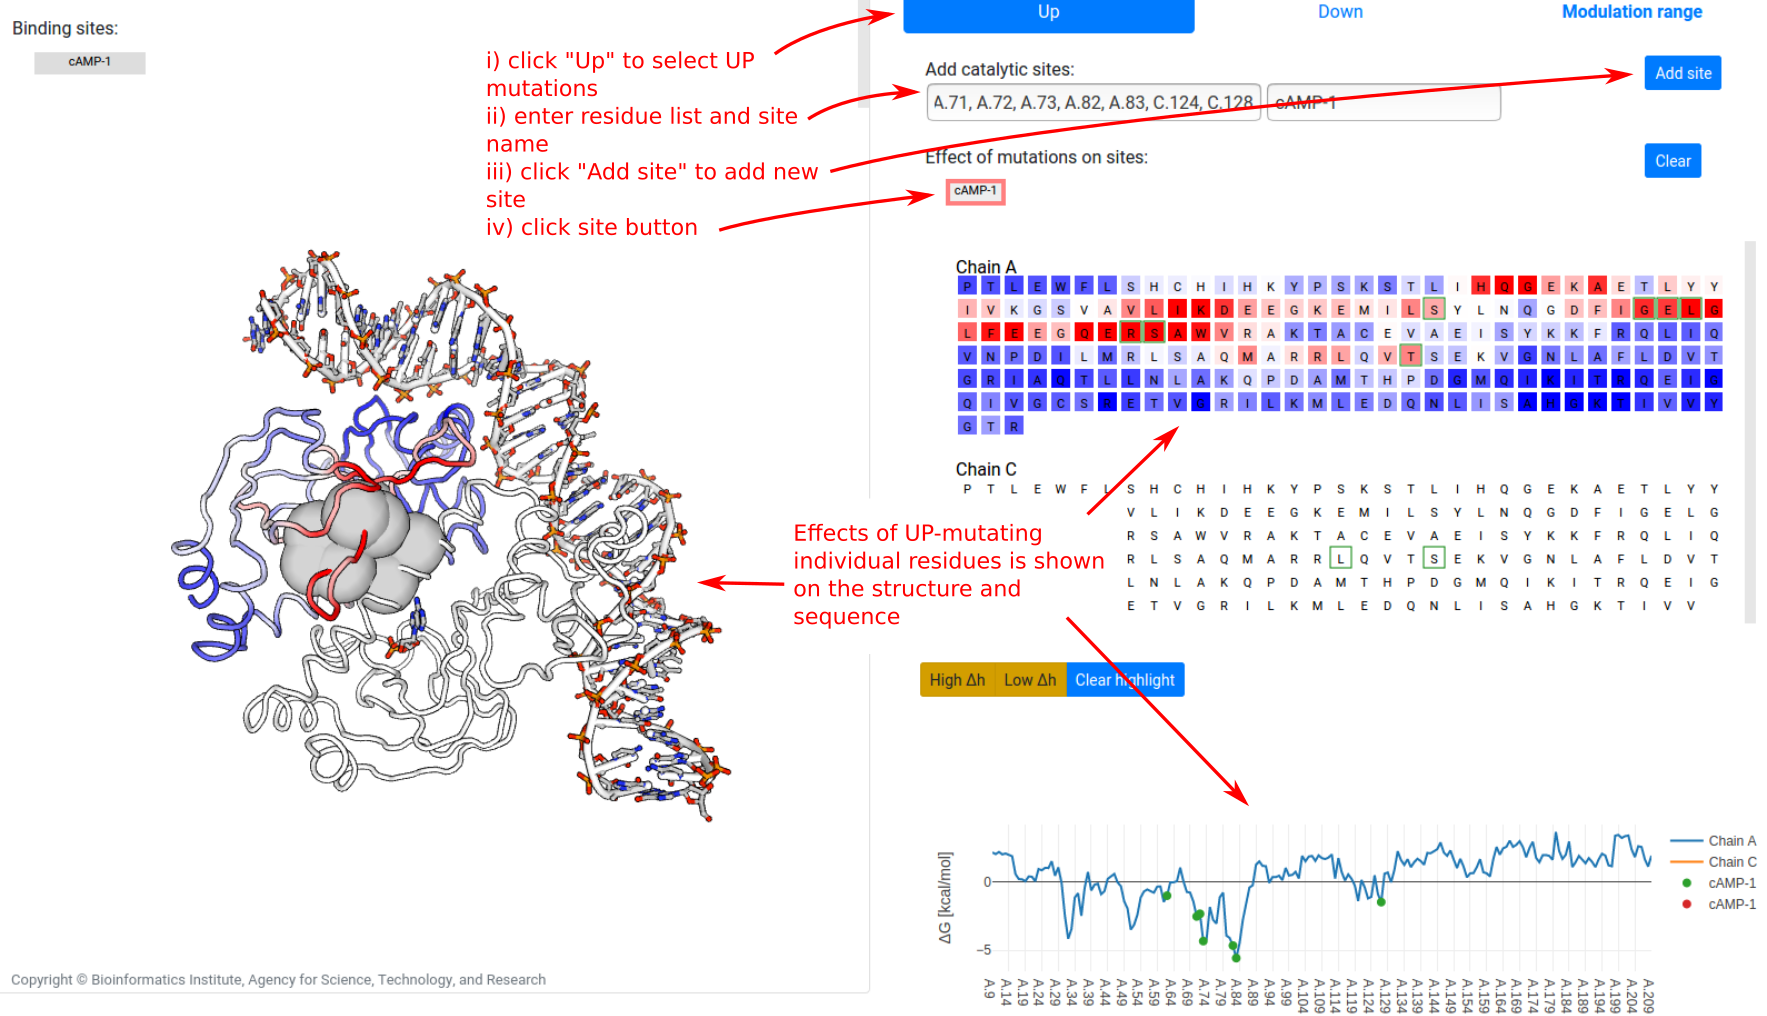
The effect on the dynamics of the binding site (defined as the per-residue free energy change averaged across bound residues) due to single-residue mutations is plotted on the sequence and structure views. Note that no data is shown for chain C in the example, as mutations on chain C were not tested.
As a further example, the ASM for 3PFK can be retrieved using the Job ID F78LZU4F.
Example: Allosteric effect of small-probe binding in CAP
A similar scanning operation may be performed to study the allosteric effects of simulated binding of small probes on three consecutive residues, obtaining the allosteric probing map (APM) of the protein, as shown in Figure 18 for CAP (1RUN). The visualization tools for APMs is identical to that of ASMs (see above), except that each binding site is denoted by the first bound residue in the protein sequence.
The APM for 3PFK can also be retrieved using the Job ID DKULMJS7.
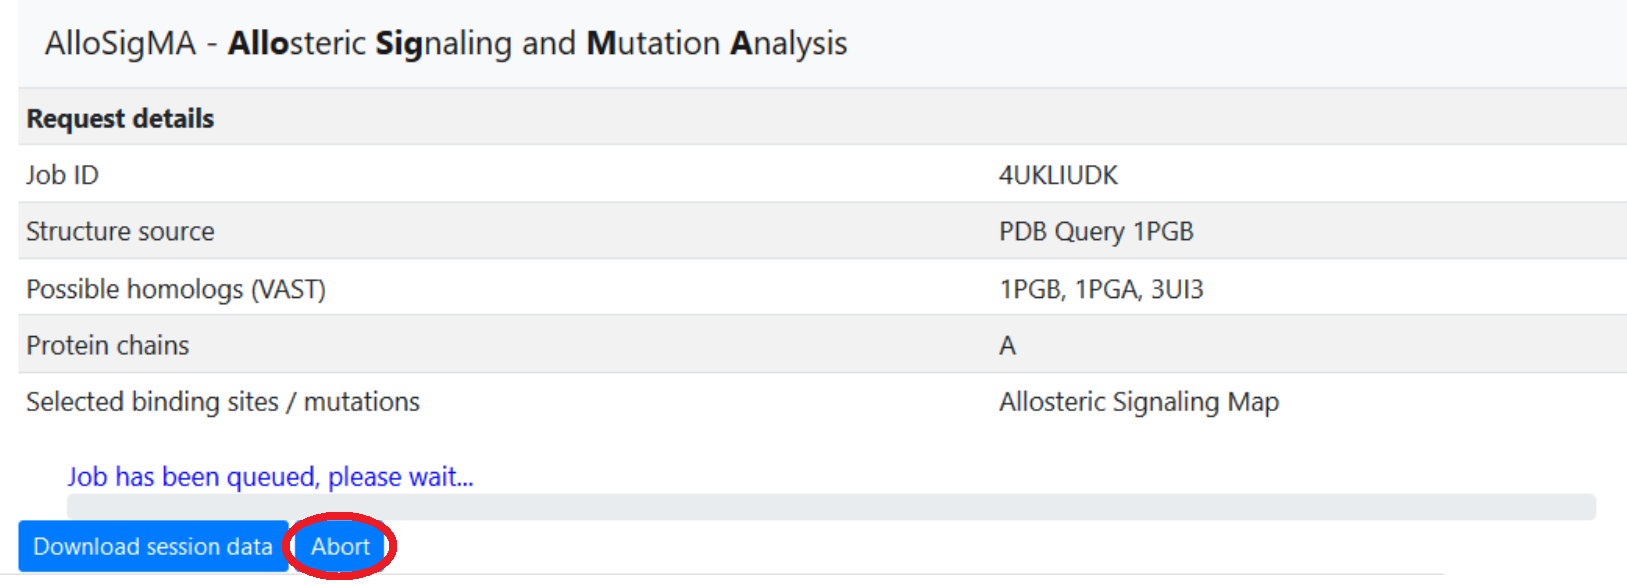
Cancelling jobs
In the event that a user needs to cancel a job, an Abort feature has been implemented to allow the user to terminate a running job, removing all associated data from the server. This option is available on the Results page, which can be reached immediately after job submission (a page refresh may be required to unlock the interface on some browsers), or accessed later using the Restore session function on the main page.
Downloading data files
Clicking on the “Download session data” button located in the upper left side of the page allows the user to download a zip-compressed file that is named according to the Job-ID.zip. The contents of the archive depends on the mode of operation selected.
For "Binding sites and mutations" jobs, the archive contains three files and a folder with the following data:
- the *.pdb file of the structure with allosteric free energies in the place of residue temperature factors
- the *.png file of the free energy profiles of individual chains
- the *.txt file containing residue names/numbers and corresponding free energies in kcal/mol.
- the WorkFiles folder contains machine-read data in json and pdb format required for restoring old sessions that have been removed from the server. Given the current user traffic, sessions more than three months old will be cleared from the server.
For "Allosteric signaling/probing map" jobs, the archive contains three PDF files of the ASM/APM plots, and a WorkFiles folder containing the PDB structure file, miscellaneous files required for restoring old sessions, as well as the following useful JSON files:
- *_mutationlist.json, the list of mutated residues tested in ASM computation
- *_probelist.json, the list of positions of small binding probes tested in APM computation
- *_responselist.json, the list of residues on which free energy changes is computed
- *_ASM_UP.json, a 2-dimensional array ΔgUPij, where the row-index i corresponds to the residue being UP-mutated, and column-index j refers to the residue showing the given free energy change. The 2D array for DOWN mutations is similarly named, as are the APM arrays.
Note: We suggest that users download and archive session data files for future reference, as sessions older than three months will be removed from the server cache. Data for these removed sessions may still be visualized on the server using the Visualize Session Data tab.
Benchmarking
While "Binding sites and mutations" jobs typically take less than 15 minutes, "Allosteric signaling/probing map" jobs take much longer. The following list of test cases provides an indication on how the expected computation time for ASM/APMs scales with protein size (number of residues):
- 1PGB (56 residues): 3 minutes
- 1RUN (398 residues): 5 hours
- 3PFK (1276 residues): 3 days
Restoring or visualizing old sessions
Users may access data from previous sessions through the "Restore Session" and "Visualize Session Data" tabs in the home page. For sessions less than 3 months old, users may return to the last step reached by entering the Job ID (as well as the user email address, if provided), and resume with further computations if necessary. This is useful also when submitting jobs for large proteins that require long computation times: the user may exit the browser, and return at a later time to check if the request has been completed.
For sessions more than 3 months old, the user may upload the session Job-ID.zip file (explained here) for visualization purposes. We recommend that users download and archive session data files for future reference, as old sessions will be removed from the server cache.
PDB file format
Please ensure that uploaded PDB files have the ATOM (atomic coordinates) section formatted as follows, according to PDB entry format version 3.3:
ATOM      1  N   MET A   1      12.969  18.506  30.954  1.00 15.93           N
ATOM      2  CA  MET A   1      13.935  18.529  29.843  1.00 17.40           C
ATOM      3  C   MET A   1      13.138  18.692  28.517  1.00 14.65           C
ATOM      4  O   MET A   1      12.007  18.222  28.397  1.00 13.04           O
ATOM      5  CB  MET A   1      14.733  17.216  29.882  1.00 20.72           C
Note that deviations from the accepted PDB format may result in irregular behavior of the server.
Note on browsers
The AlloSigMA web service has been tested on the following browsers:
| OS | Version | Chrome | Firefox | Microsoft Edge | Safari |
|---|---|---|---|---|---|
| Linux | Ubuntu 16.04 | not tested | 73.0 | n/a | n/a |
| Mac OS | Mojave | not tested | 73.0 | n/a | 13.0 |
| Windows | 10 | 80.0 | 73.0 | 44 | n/a |
For optimal user experience, we recommend using Mozilla Firefox.
References
- Allosteric sites: remote control in regulation of protein activity E. Guarnera and I. N. Berezovsky. Curr Opin Struct Biol, 2016 vol. 37 p. 1-8.
- On the perturbation nature of allostery: sites, mutations, and signal modulation E. Guarnera and I. N. Berezovsky. Curr Opin Struct Biol, 2019 vol. 56 p. 18-27.
- Structure-Based Statistical Mechanical Model Accounts for the Causality and Energetics of Allosteric Communication. E. Guarnera and I. N. Berezovsky. PLoS Comput Biol, 2016 vol. 12 (3) p. e1004678.
- Reversing allosteric communication: From detecting allosteric sites to inducing and tuning targeted allosteric response W.-V. Tee, E. Guarnera and I. N. Berezovsky PLoS Comput Biol, 2018 vol. 14 (6) p. e1006228.
- Toward Allosterically Increased Catalytic Activity of Insulin Degrading Enzyme (IDE) Against Amyloid Peptides. I. V. Kurochkin, E. Guarnera, J. H. Wong, F. Eisenhaber, and I. N. Berezovsky. Biochemistry, 2016 vol. 56 (1) p. 228-239.
- AlloSigMA: allosteric signaling and mutation analysis server E. Guarnera, W.-V. Tee, Z. W. Tan and I. N. Berezovsky Bioinformatics, 2017 vol. 33 (24) p. 3996-3998
- Towards comprehensive allosteric control over protein activity. E. Guarnera and I. N. Berezovsky. Structure, 2019 vol. 27 (5) p. 866-878.e1
- On the Allosteric Effect of nsSNPs and the Emerging Importance of Allosteric Polymorphism W.-V. Tee, E. Guarnera and I. N. Berezovsky J Mol Biol, 2019 vol. 431 (19) p. 3933-3942.
- AlloSigMA 2: paving the way to designing allosteric effectors and to exploring allosteric effects of mutations Z. W. Tan, E. Guarnera, W.-V. Tee and I. N. Berezovsky. Nucleic Acids Research, 2020, DOI: 10.1093/nar/gkaa338