Introduction
This sequence-dependent model of allostery [1] implemented in the AlloSigMA server [2, 3] is a new network-based high-throughput version of the Structure-Based Statistical Mechanical Model of Allostery [4, 5]. It allows users to addresses a fundamental challenge in structural bioinformatics - the role of amino acid sequences in driving the allosteric communication in proteins. Allostery—the regulatory mechanism by which binding at one site influences activity at a distant site—is ubiquitous in biological systems, representing one of the most important research directions in drug design and protein engineering [6-8]. The sequence-dependent model is based on the network representation of the protein structure and on the exact consideration of the amino acid types using the Miyazawa-Jernigan residue-residue interaction potential to capture sequence-specific peculiarities and effects of mutations. This hybrid approach enables researchers to move beyond purely structural analyses by incorporating the chemical properties and interaction preferences of individual amino acids, offering, thus, computational tools that bridge the gap between sequence information and functional allosteric behaviour (see Figure 1):
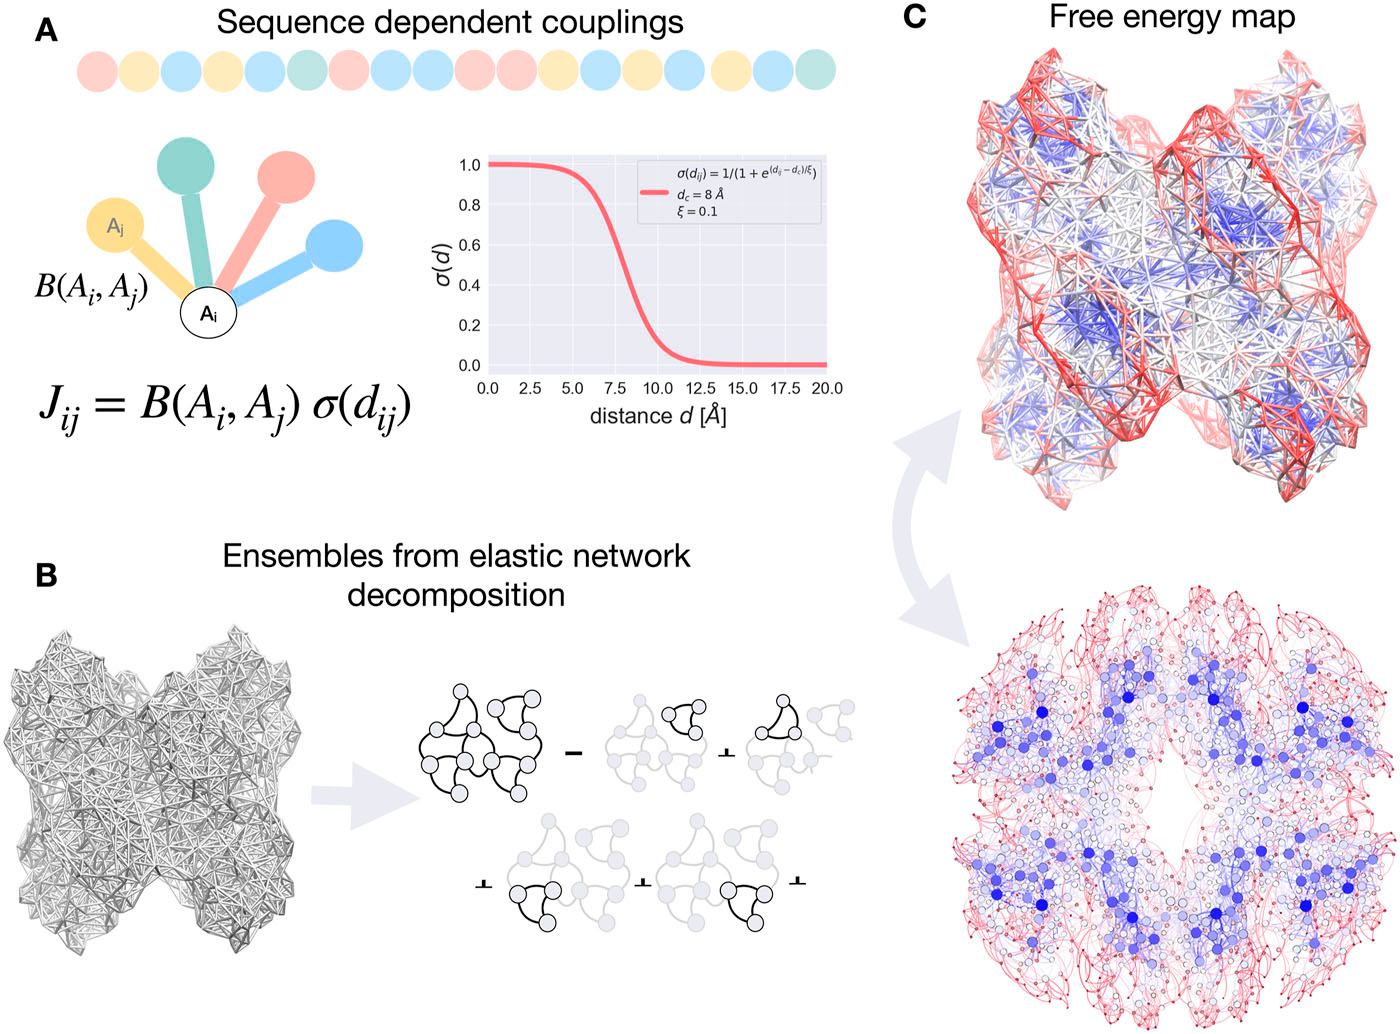
Network-based sequence-dependent allosteric models enable exploration of complex signaling from ligand binding and mutations. By analyzing bidirectional signaling pathways, these models identify latent allosteric sites for designing regulatory exosites and effector molecules to tune desired signaling outcomes.(see Figure 1)
This tutorial guides the user through the functionality of sequence-dependent model of allosteric communication via several examples. The computational framework of the Server consists of several steps, some of them are optional depending on the problem the user is interested to address.
We recommend users to follow the steps prescribed below and not use back/forward buttons on the browser, as this may result in unexpected errors. Buttons for stepping back or aborting job submissions are provided on the server, below job details.
In the following examples the tetrameric enzyme phosphofructokinase (PFK) is used. PFK is a textbook example of the allosteric regulation of protein function. In particular, the enzyme is allosterically inhibited by phosphoenolpyruvate (PEP) and activated by ADP binding to two overlapping binding sites. It is cooperatively regulated with respect to the binding of two substrates, fructose-6-phosphate (F6P) in the presence of PEP. The apo form (PDB ID 3pfk) was used here to perform the calculations.
Input Data
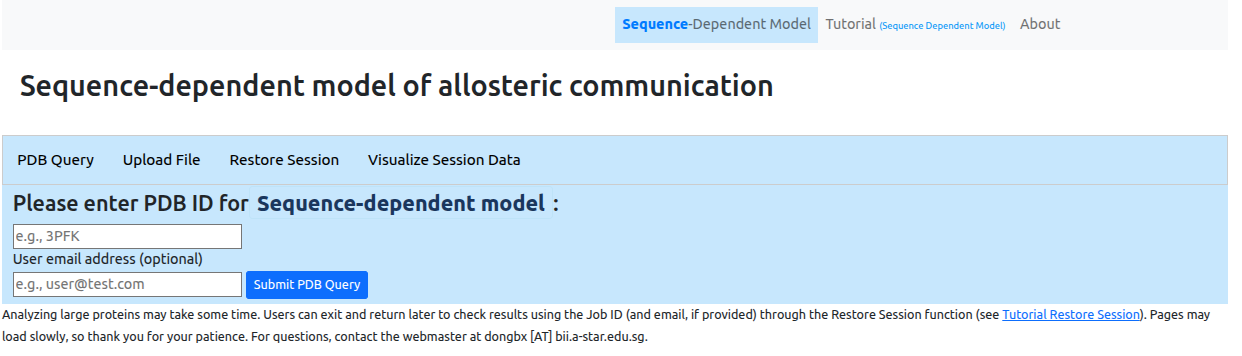
At the first step the user is asked to provide a PDB
ID for the protein of interest. Alternatively, the
user can upload a protein structure file in
pdb format
(Figure 2). Users may provide an email address to receive
a notification when the job completes. From this page one
can also restore a previous session
from the job ID or visualize
the data associated with the session.
Biological assemblies and homologs
First, the server connects to EBI PISA database and uses the best matching assembly that corresponds to the PDB ID entered by the user. The complete and ordered list of PISA assemblies, according to the solvation energy gain upon assembly, allows the user to choose the assembly of interest (See Figure 3 for the corresponding screenshot). By clicking on the headers of each column in the list, the explanation of the corresponding parameters will appear in a popup window. For the specifics of how to choose the most correct biological assemble we refer the user to the PDBePISA original tutorial. Typically, the top line in the PISA output gives the biological assembly. As a next step, the list of the first 10 best matching homologs (99% sequence identity) is generated from the VAST server. The list of homologs is used to extract a set of binding sites that can be used for the analysis of the effects of ligand binding. Using structural alignment the binding sites are mapped to the corresponding chains of the considered protein structure. A Job ID is also assigned to the current process.
Due to file formatting constraints, the system is able to process only up to a maximum of 40 chains (as defined in the structure file): selecting assemblies or uploading structure files with more than 40 chains may result in unexpected errors.
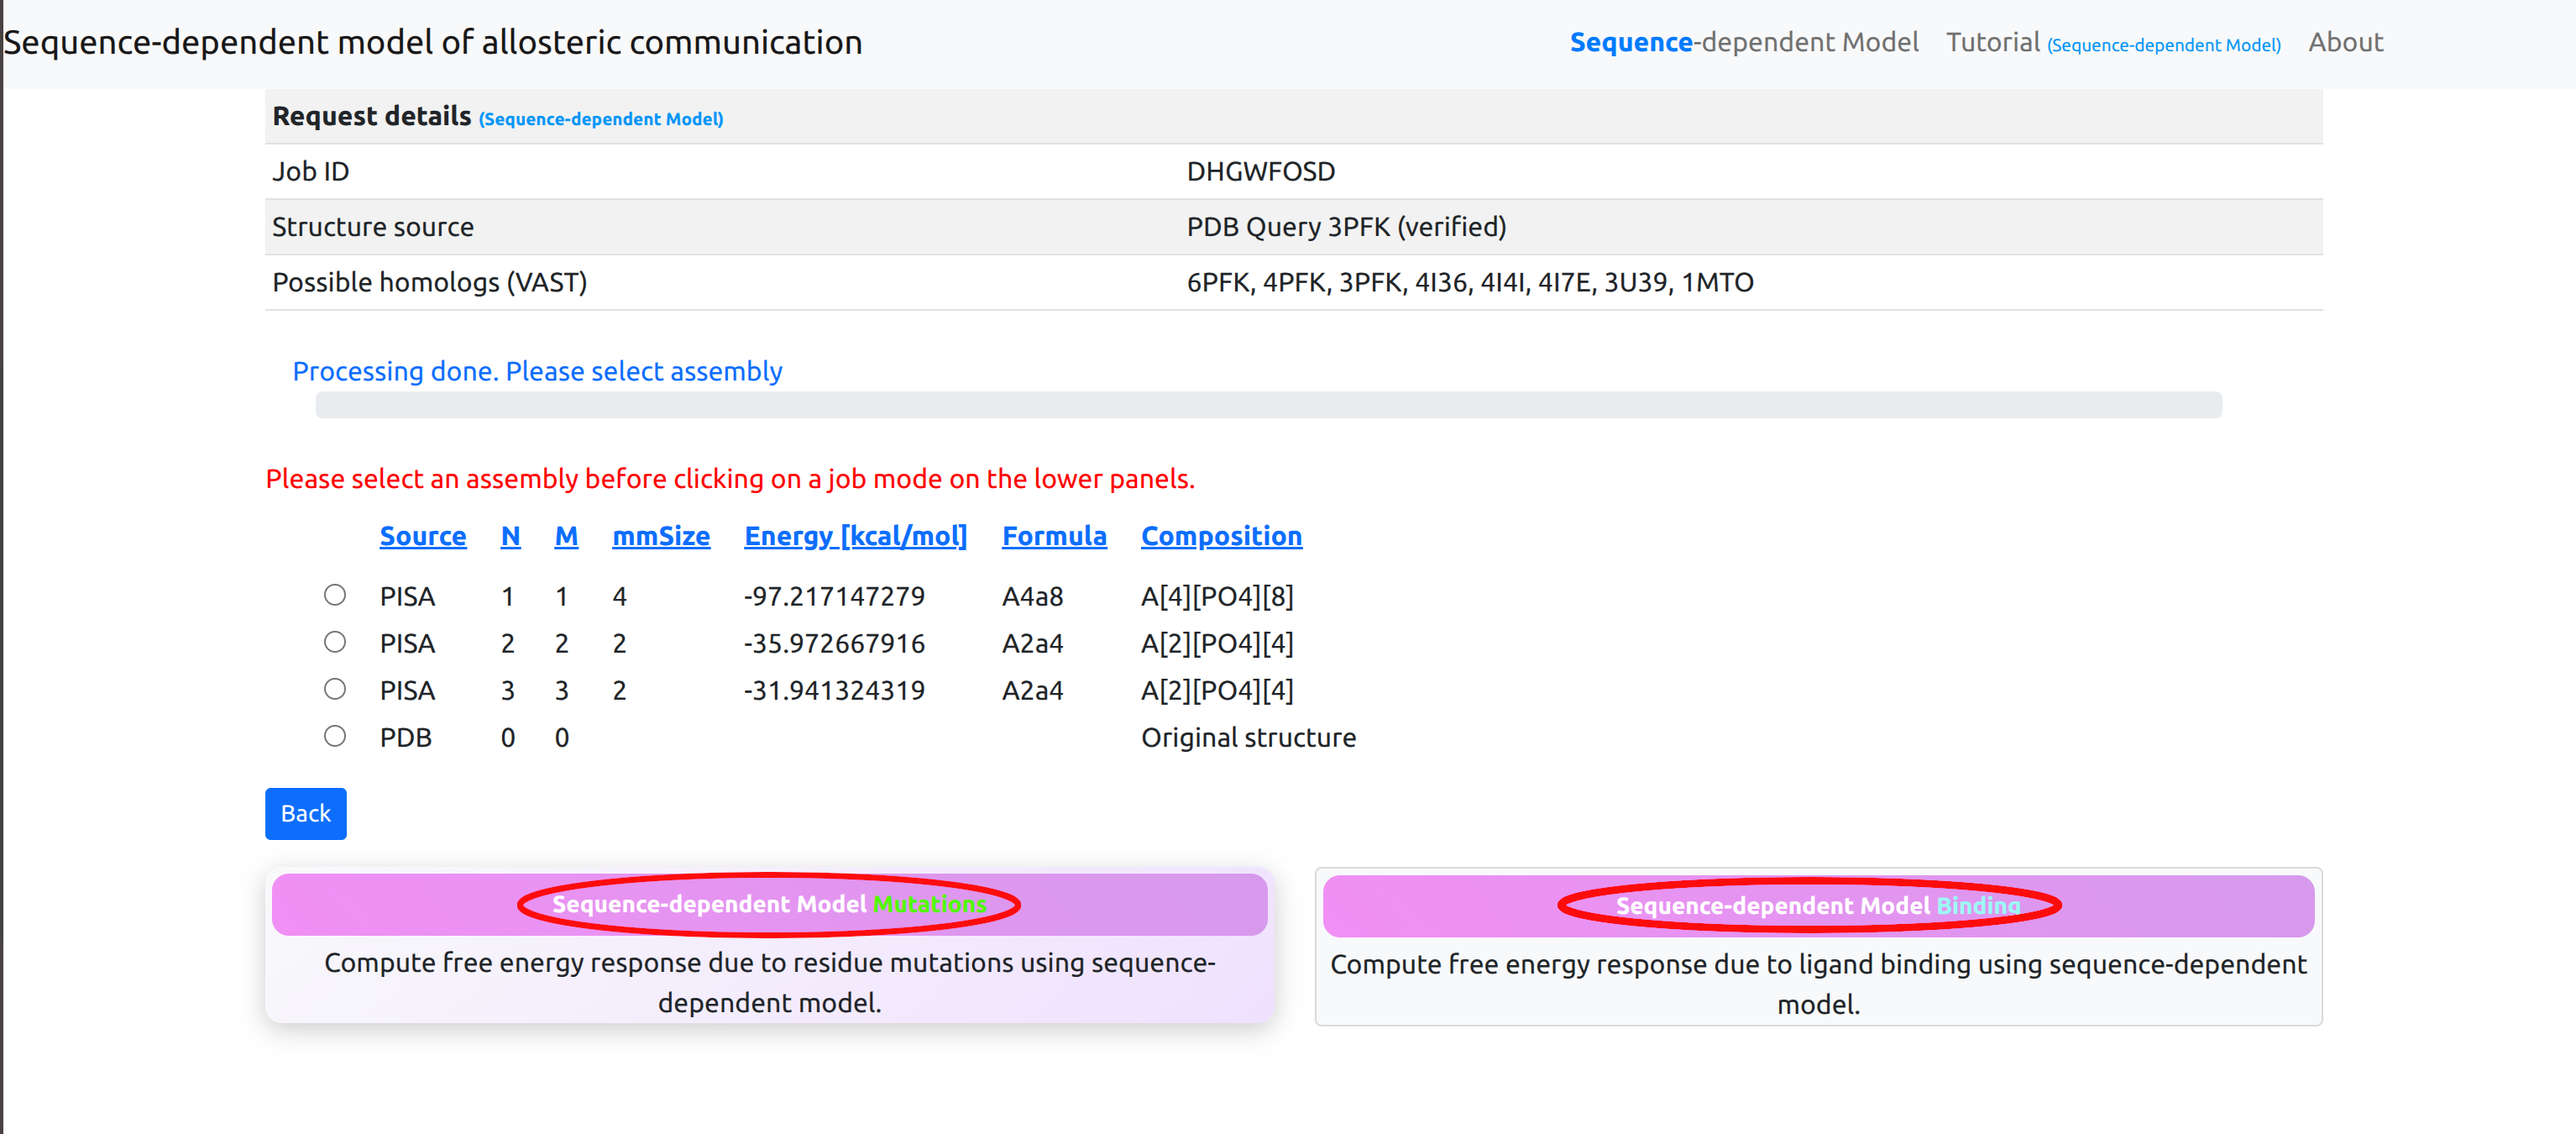
After selecting an assembly for study, users may choose between two modes of operation:
- User designated mutations: Perform a single computation of the free energy response to specified residue mutations using the sequence-dependent model.
- Binding sites: Perform a single computation of the free energy response to specified binding using the sequence-dependent model.
Protein chains
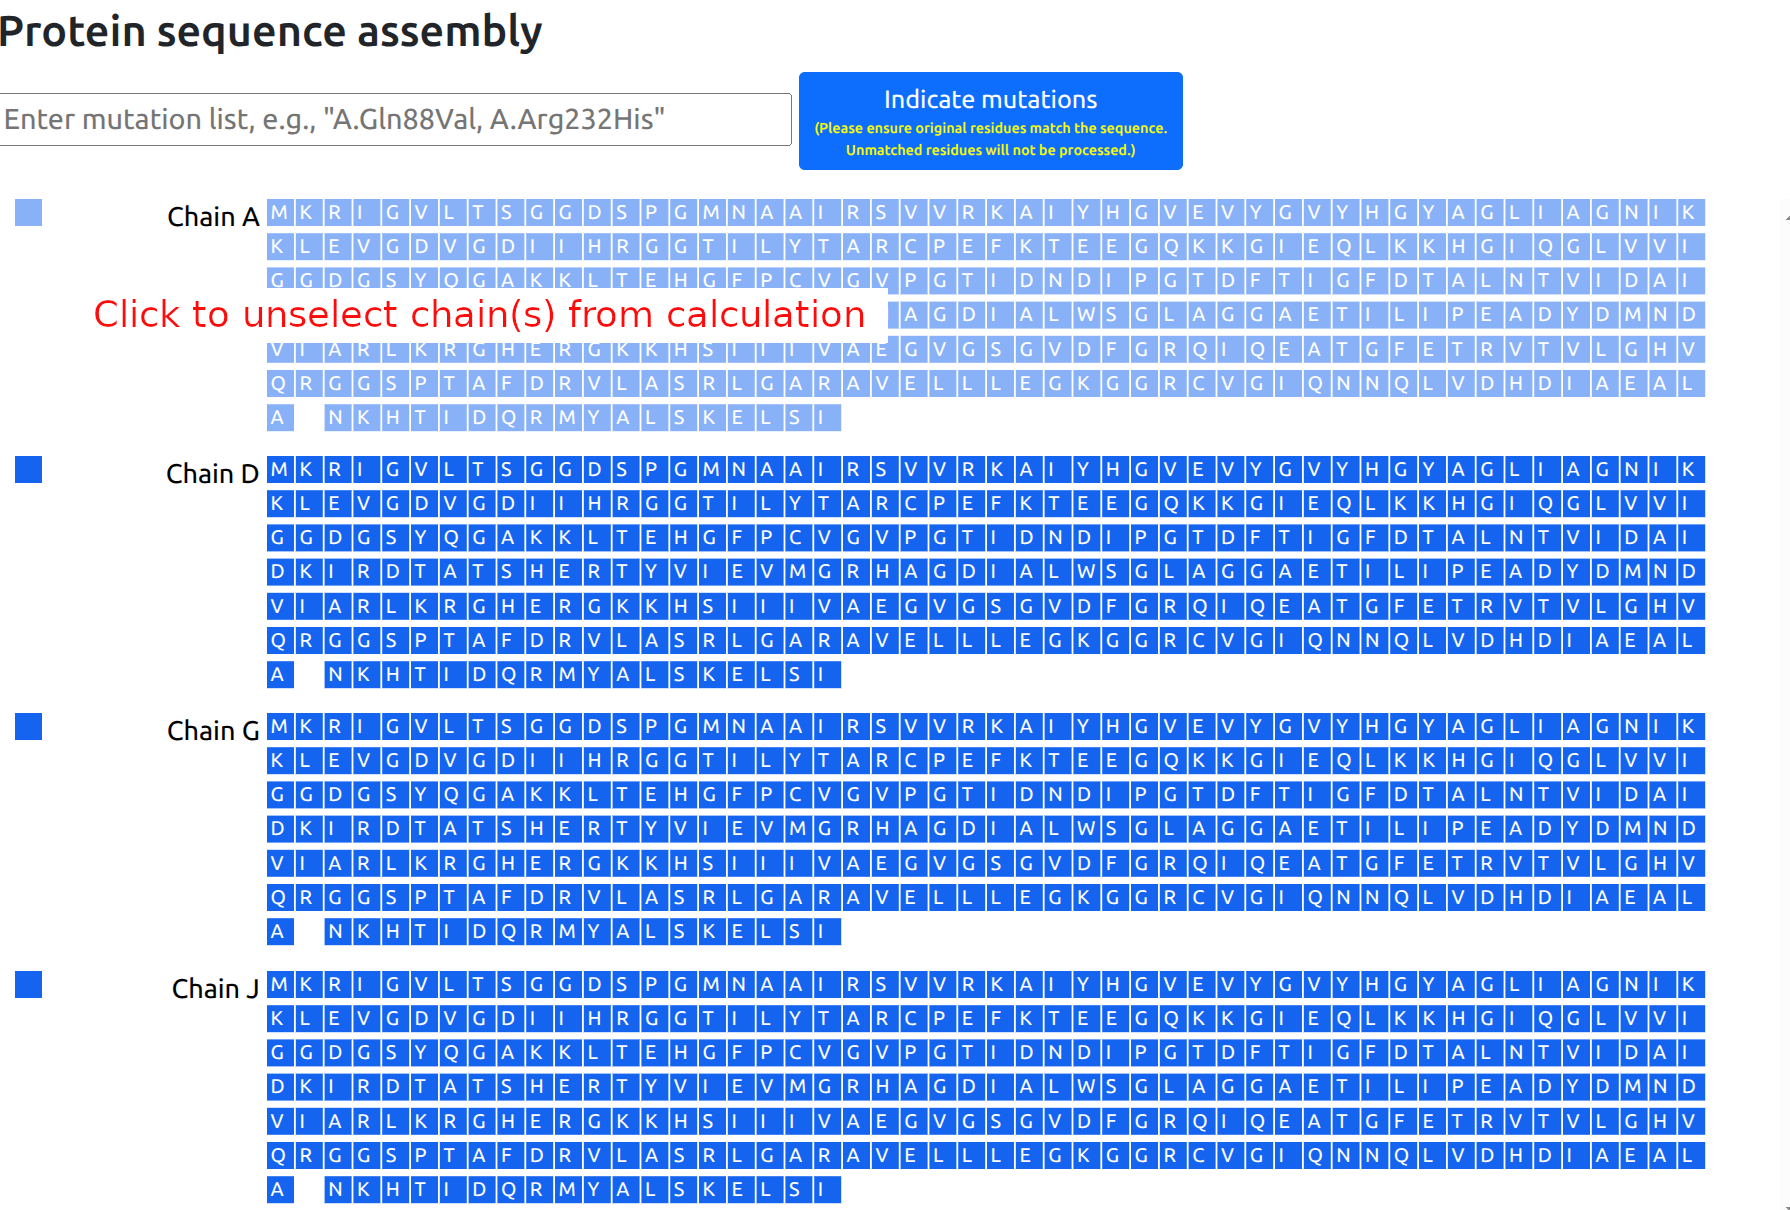
Once the protein assembly is chosen by the user, a panel with the protein chains and protein residues is provided on the left side of the page. Chains can be entirely selected to be excluded from the calculation (Figure 4). In case of discontinuities in the protein sequence, that is missing fragments or residues, a blank space is shown in the sequence at the positions corresponding to the missing residues.
Due to memory constraints, the server can only process structures with up to 5,000 protein residues. Users studying larger structures would be required to select a subset of chains to be excluded from the computation.
Usage tip: Analysis of large proteins may take a while. Users may exit the browser and return to check analysis results at a later time by referencing the Job ID (and email, if provided), through the Restore Session function.
User designated mutations
Mutations can be defined in the procedure of mutations below (See Figure 5 and 7):
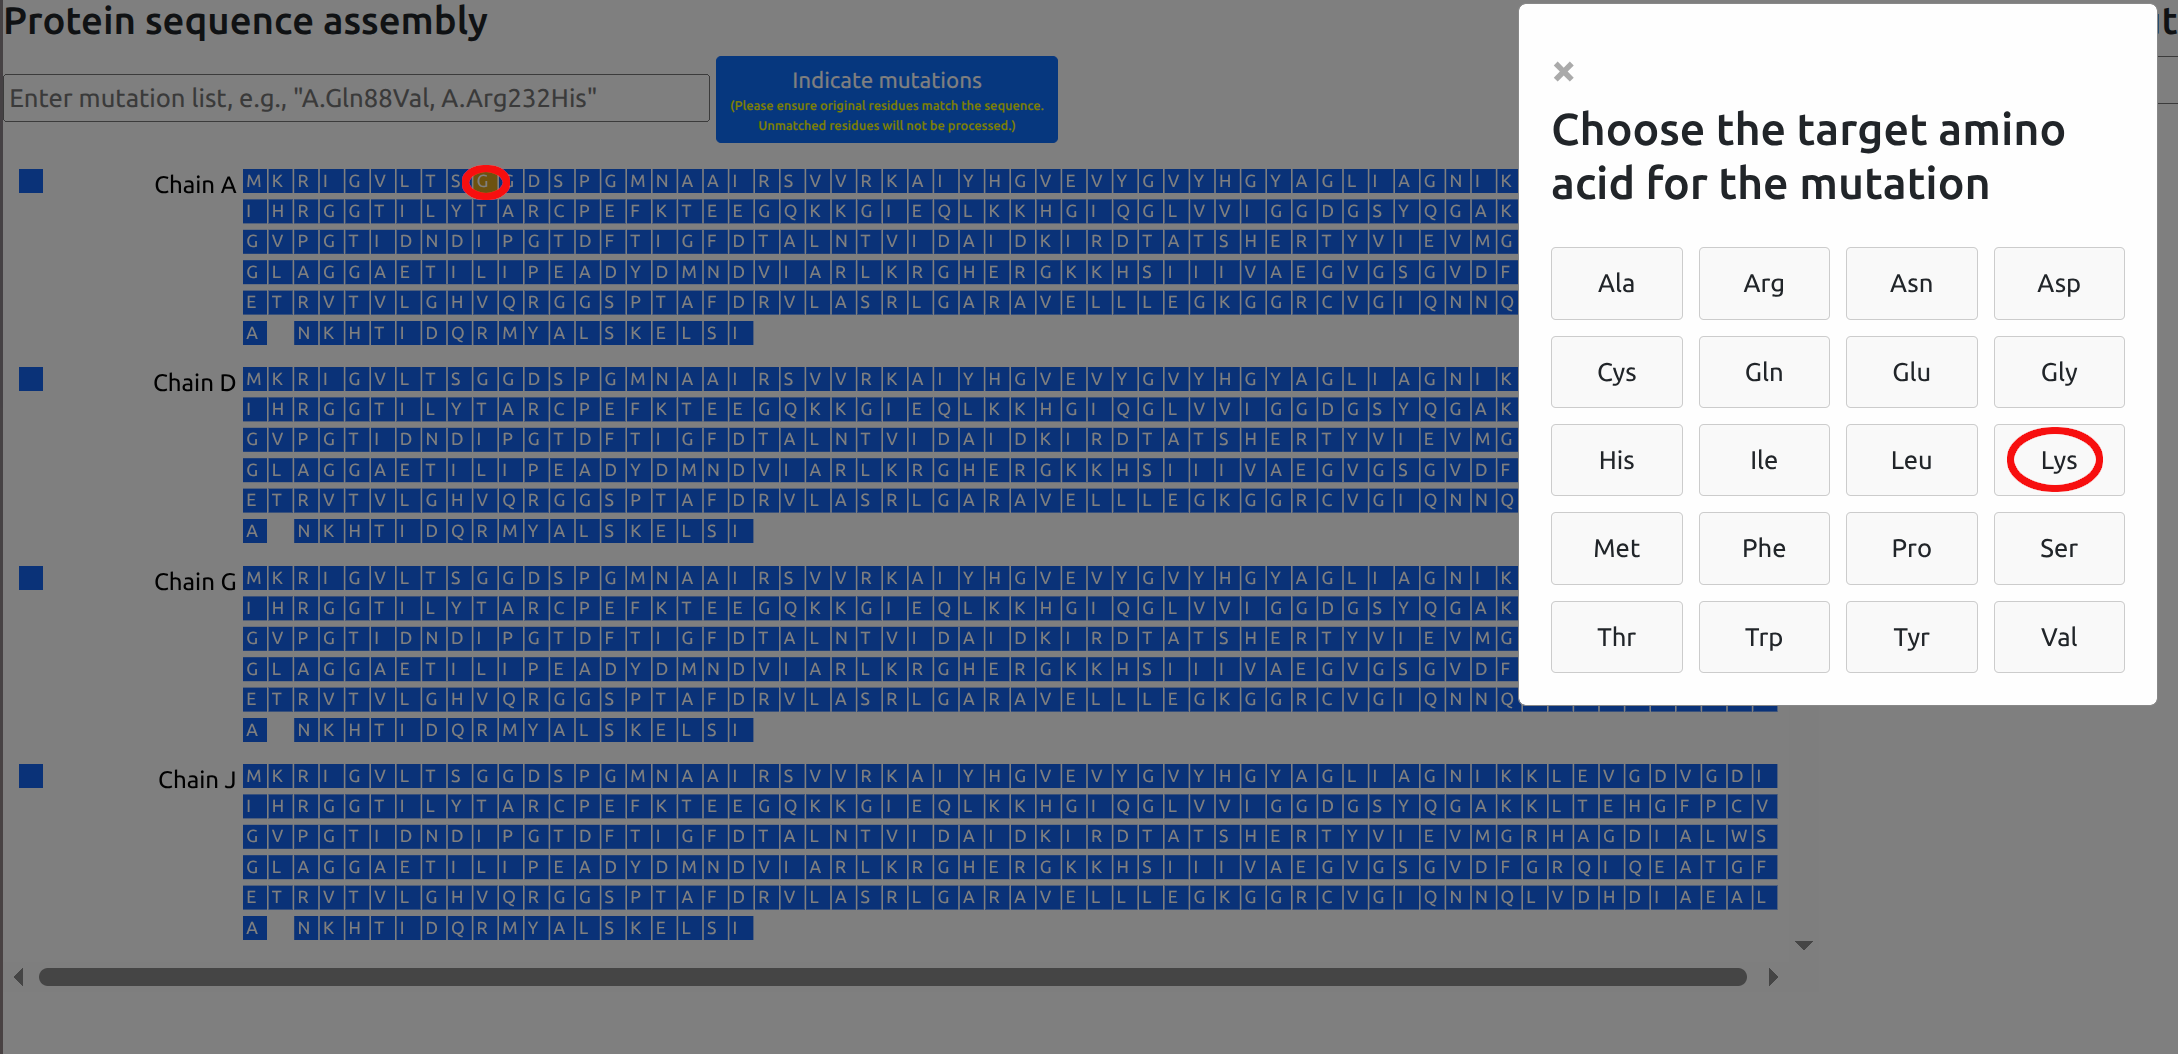
- To select residues for mutation, click on the desired residues in the left sequence panel. A popup window will appear, allowing you to choose the target residue for mutation. Once a mutation is selected, the original residue will be updated and highlighted in magenta to indicate the change. (multiple mutations are allowed, see Figure 5)
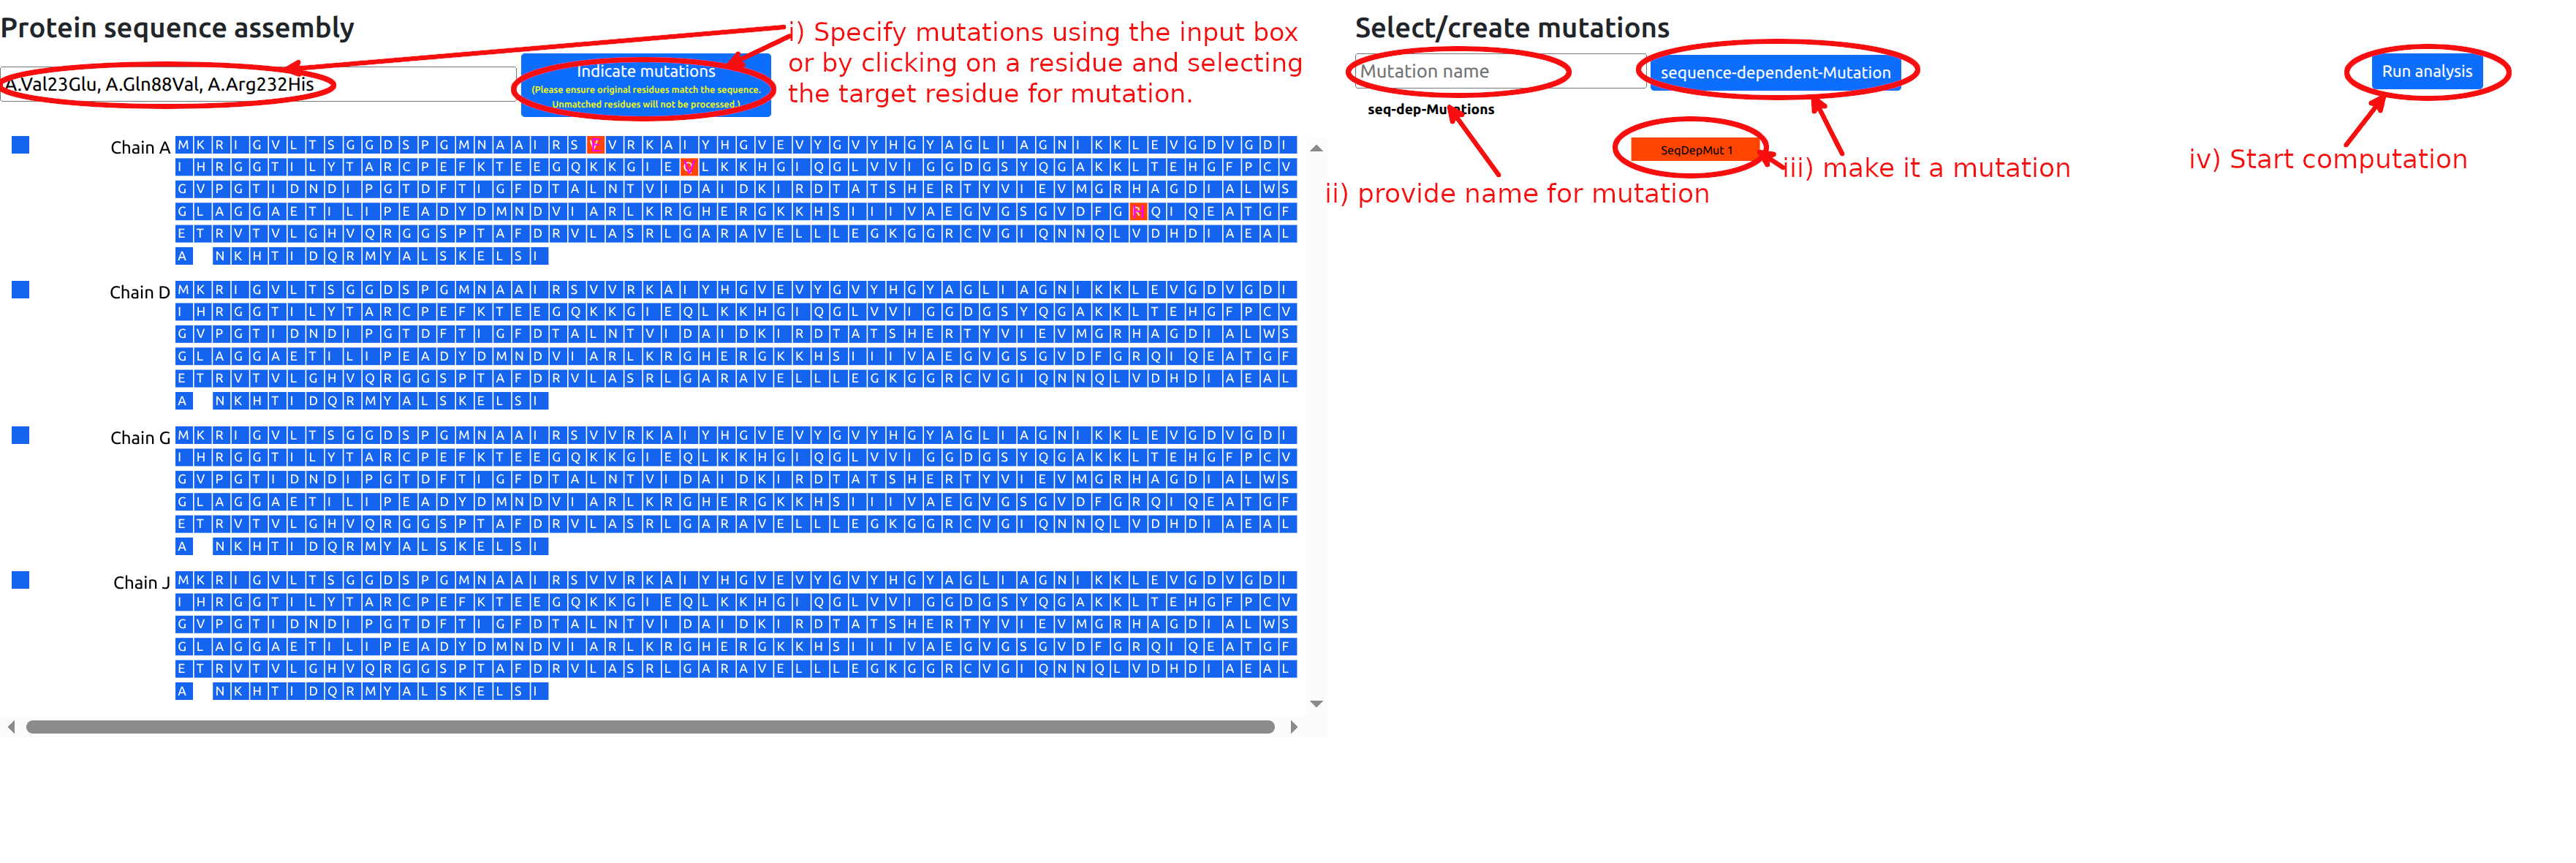
- Alternatively, desired mutations can be indicated by entering a string of chains and residue mutations (See Figure 6).
- Type in the name of the mutation or the list of mutations in the “Mutation name” form in the right panel (optional).
- Click the “sequence-dependent-Mutation” button for mutations. This will add a red button with the name of the mutation set and the corresponding residues will be turned red in the left sequence panel. Note that clicking again on the newly added red button will deactivate it, so that mutations will not be used in the calculation.
- Click "Run analysis" button to perform the calculations.
Binding sites
The second mode of operation enables users to perform a single computation of the free energy response of each residue to ligand binding.
Retrieved binding sites
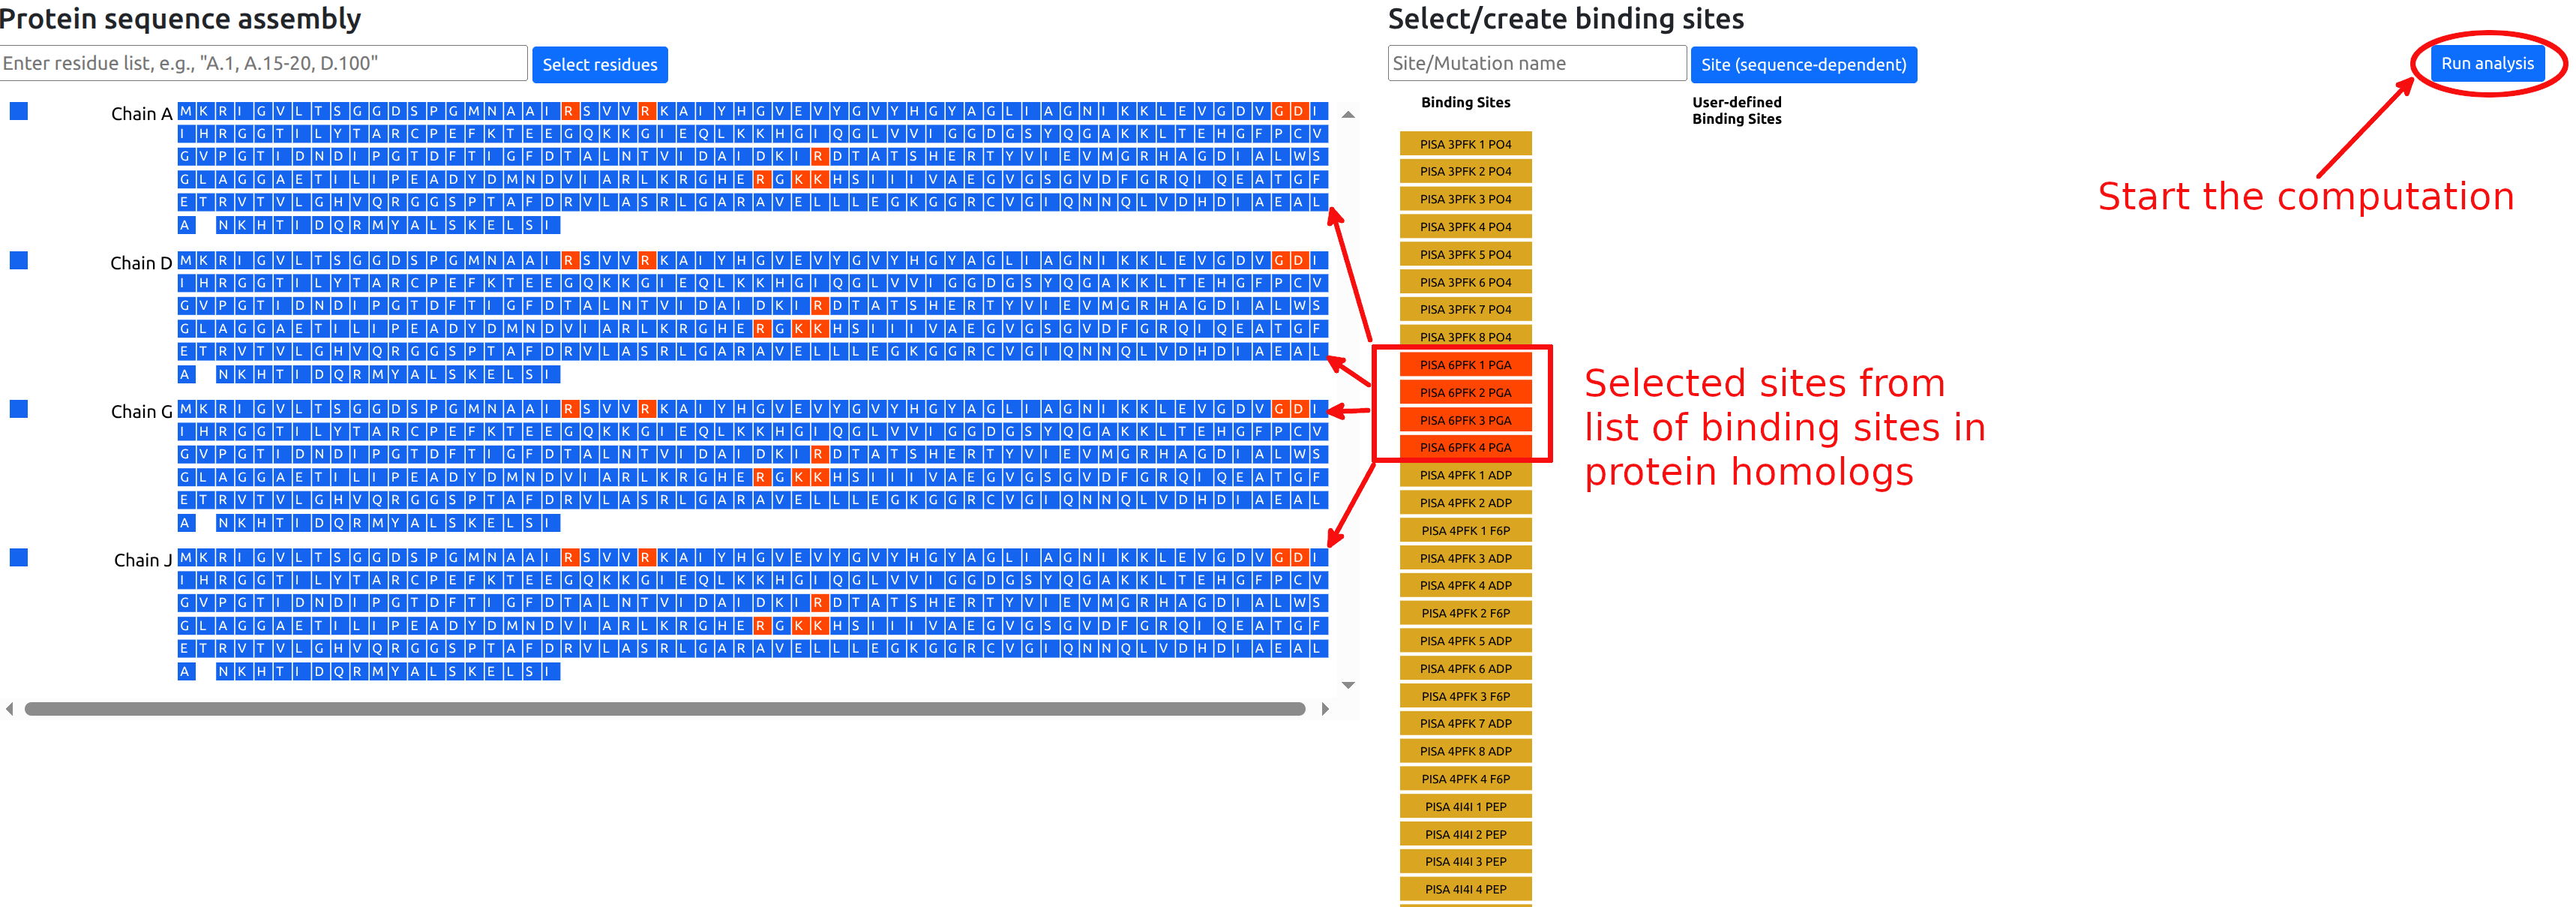
The list of retrieved binding sites is shown in the
right panel. Sites can be selected to be considered in
the calculation by clicking the corresponding buttons,
which will turn red. The corresponding residues will
turn red in the sequence panel. Figure 7 shows the
situation in which four binding sites PGA are selected
from the available list. The calculations for the
allosteric free energy caused by binding at the PGA
effector sites can be started by clicking the "Run
analysis" button. Users that have provided an email address will receive notifications when job submission is successful and when the job has completed.
Usage tip: Analysis of large proteins may take a while. Users may exit the browser and return to check analysis results at a later time by referencing the Job ID (and email, if provided), through the Restore Session function.
User designated binding sites
Besides the available binding sites obtained from homologs, the user can manually define binding sites of interest according to the following procedure (see Figure 8):
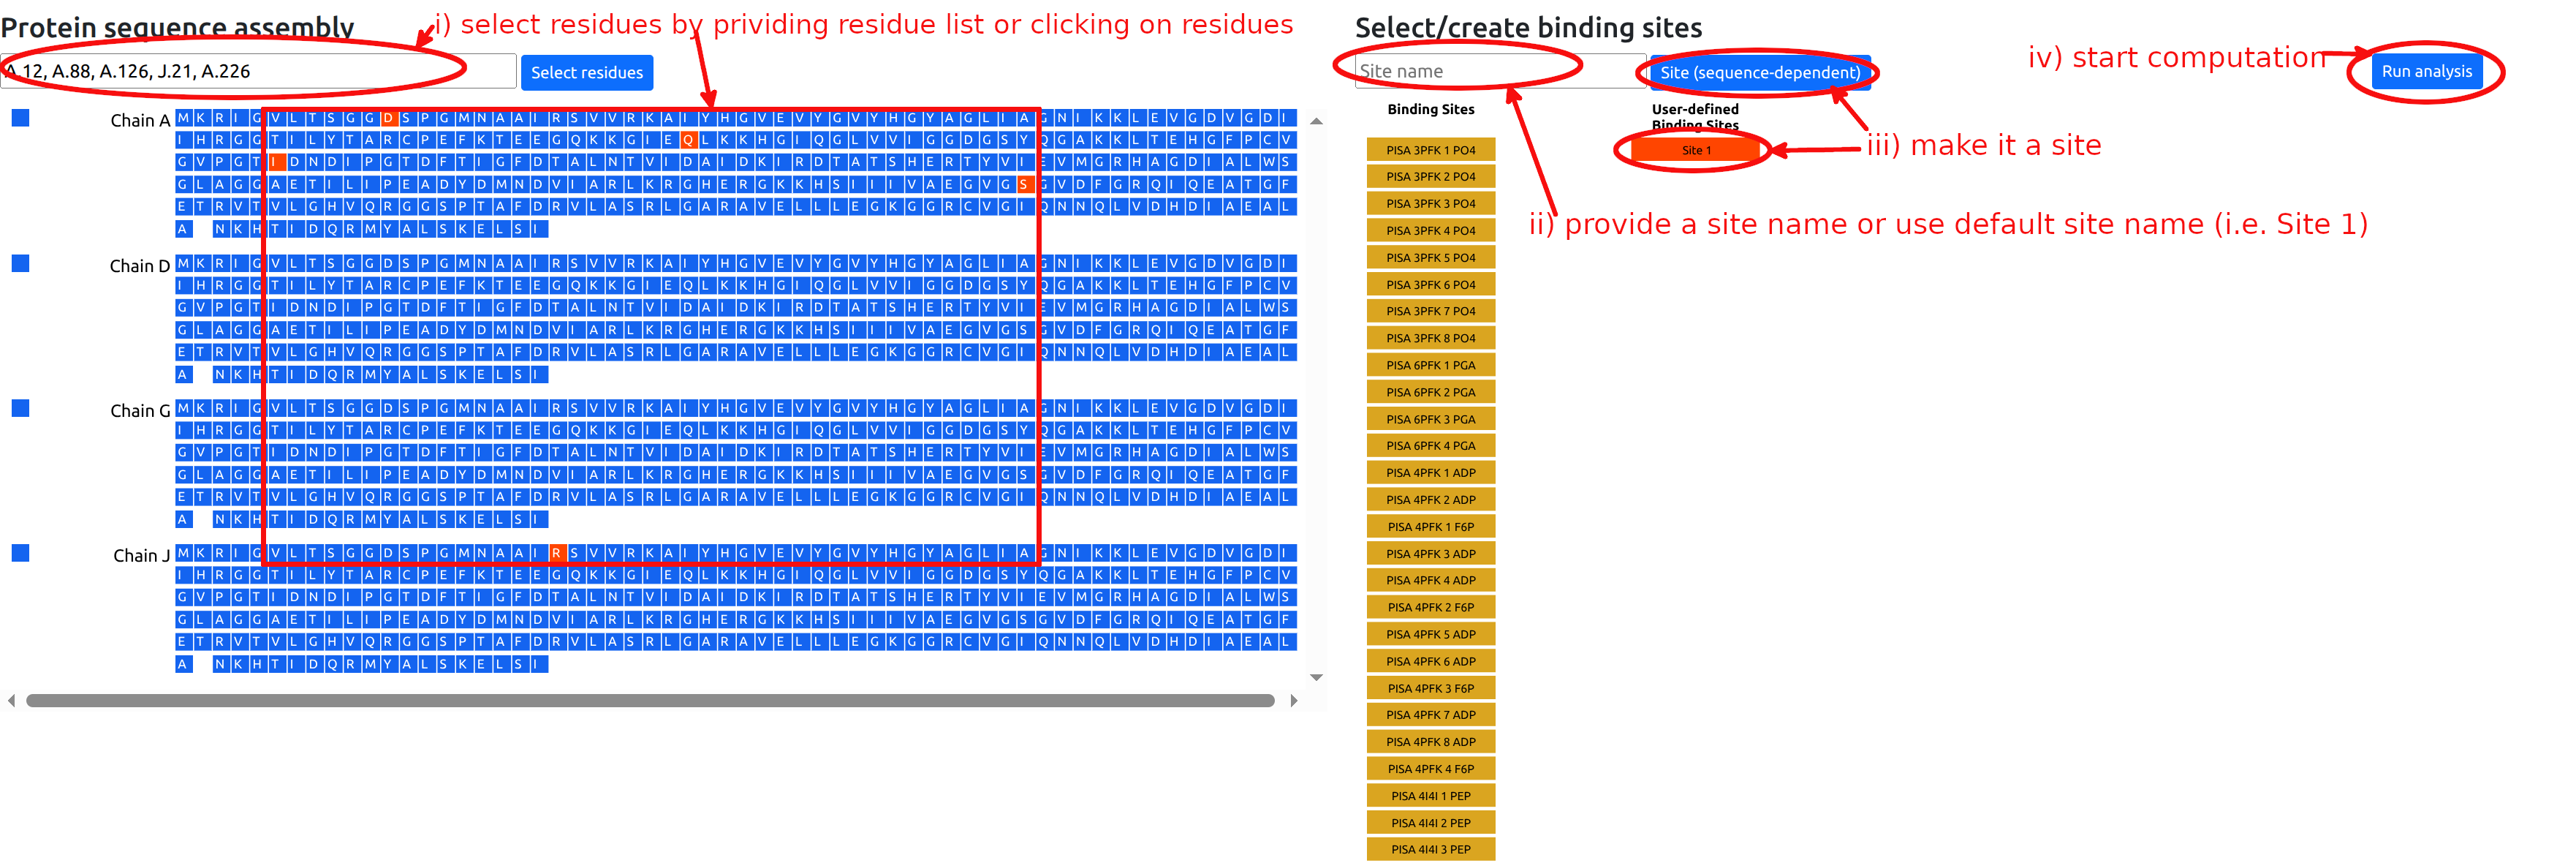
- Select residues of interest in the left sequence panel, either by entering a string of chains and residue positions, or by clicking on individual residues.
- Type in the name of the site in the “Site/Mutation name” form in the right panel (optional).
- Click the “Site” button in the right panel. This
will turn it red and select the site for
calculation. The corresponding residues will be
turned red in the left sequence panel. Note that
clicking again on the newly added red button will
deactivate it, so that the site will not be used in
the calculation.
- Click "Run analysis" button to perform the
calculations.
Note: In the following, we will illustrate how to navigate the Results page for different modes of operation with a few examples, and users may restore and view these examples using the corresponding Job IDs using the Restore Session tab on the main page, leaving the email field empty.
Example: Mutations in PFK
We show how to investigate the effect of a mutation on the PFK energetics(Job ID 648ALM84). The definition of sequence-dependent mutations is outlined in the Mutations section. We first consider a point UP-mutation at residue 200 in the chain A (see Figure 9).
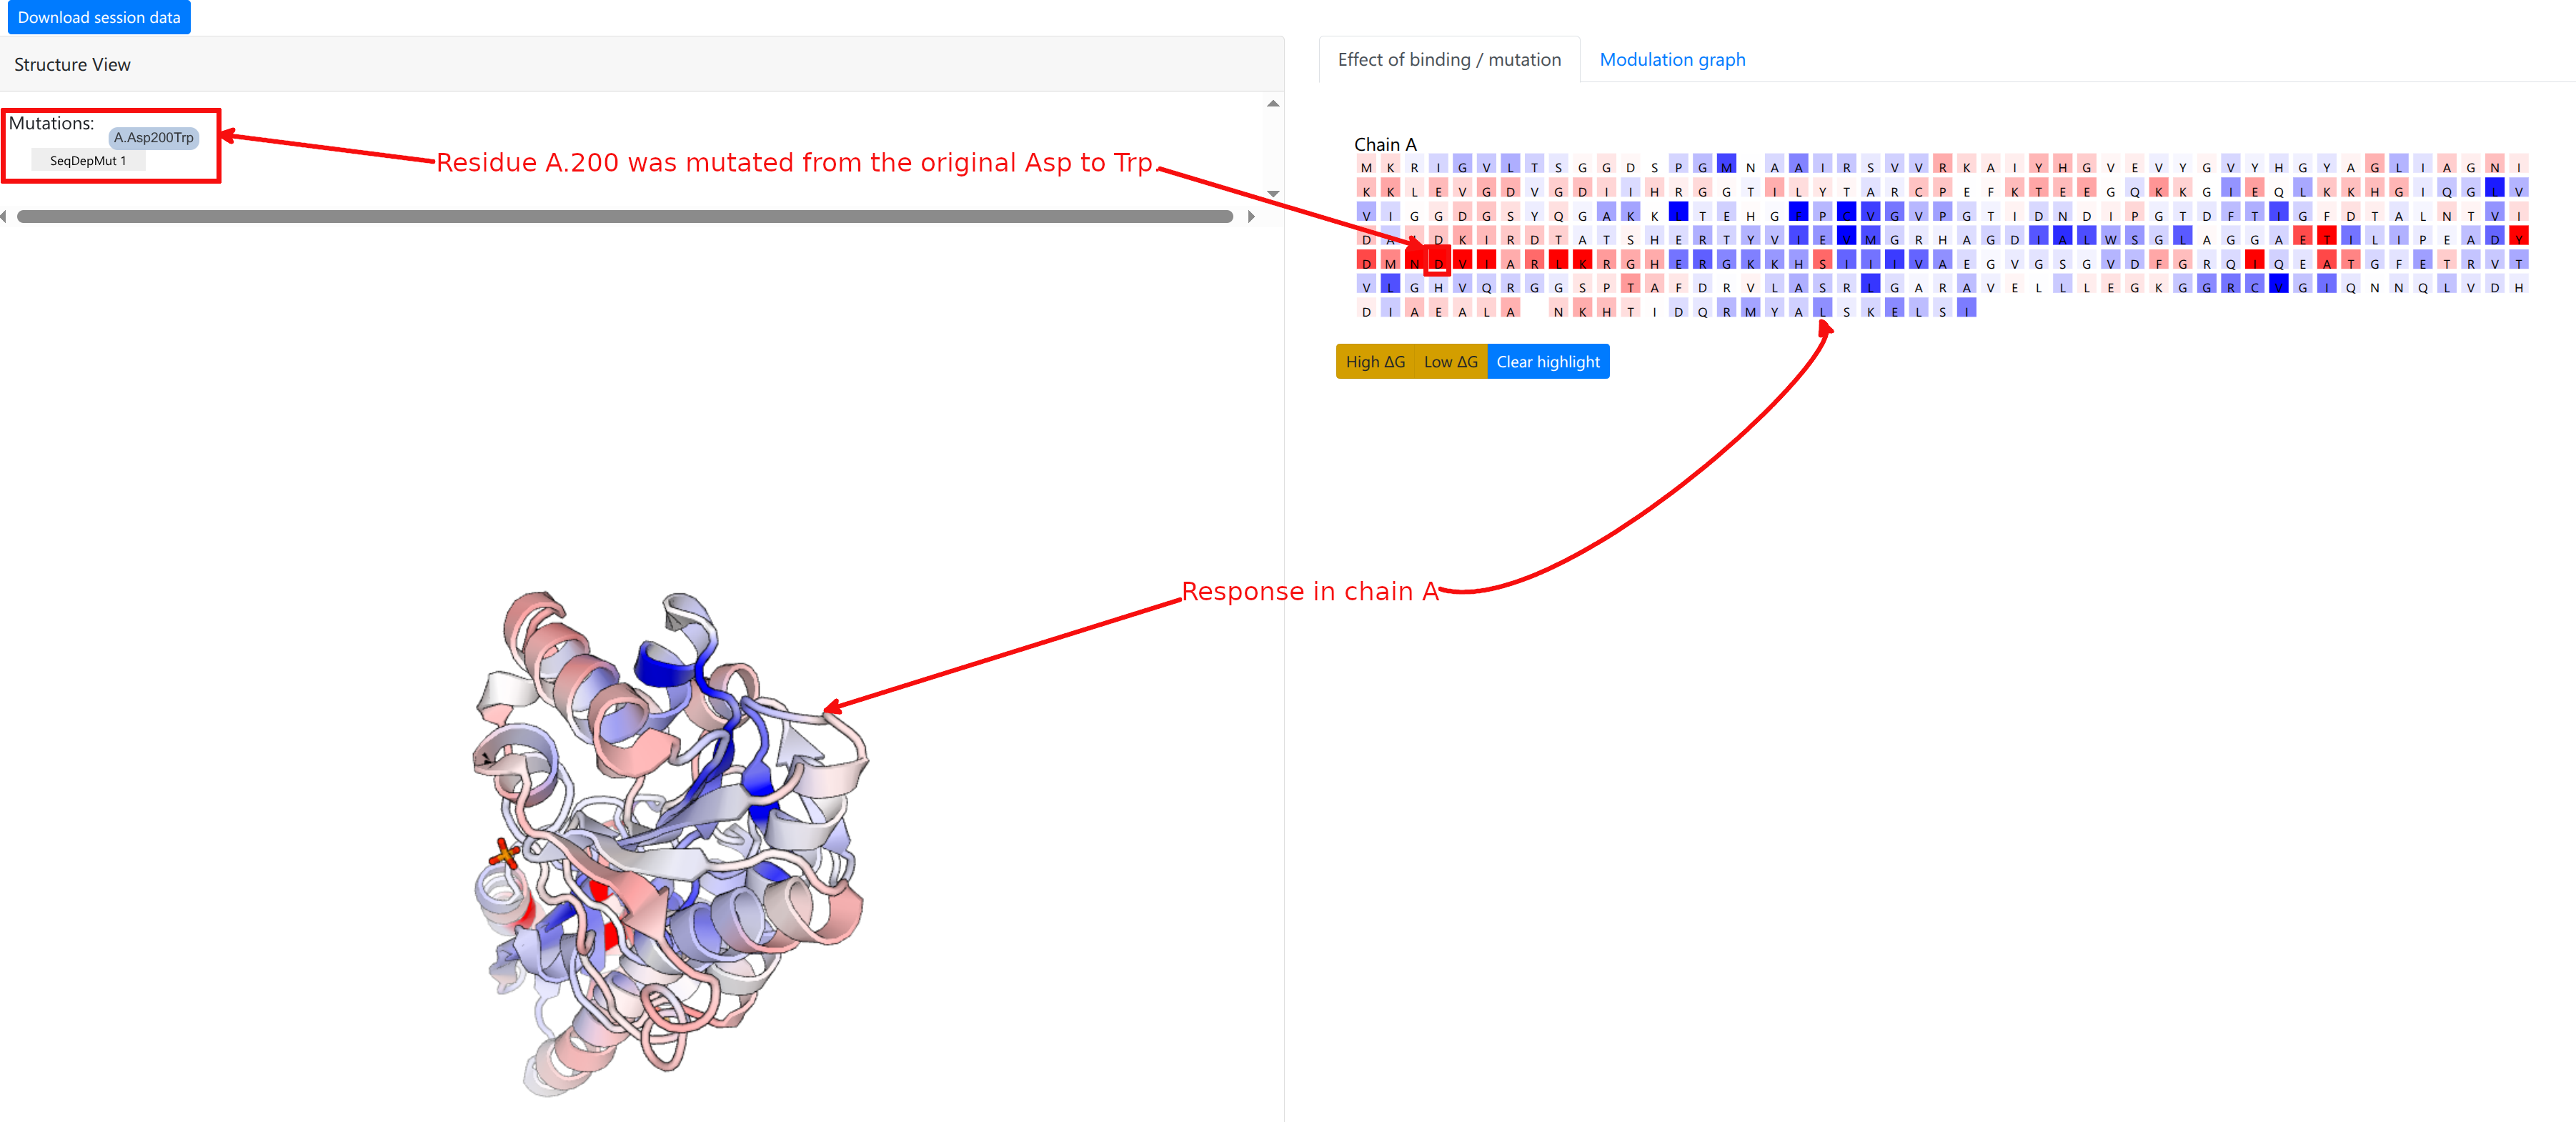
The computation result is displayed in two panels, with the left panel showing the results on the 3D spatial model, and the right panel displaying results on the protein chains and sequences.
The “Structure View” panel (Figure 9, left) lists the mutations, and shows the protein with chains rendered efficiently using PV colored according to the per-residue allosteric free energy values Δgi. A Red-White-Blue color map is used to illustrate the energy values: Blue color (positive Δgi) indicates enhanced conformational changes, red color (negative) indicates suppresed conformational changes upon effector binding. White-colored residues have their dynamics mostly unaffected by effector binding.
Example: Binding at PGA site in PFK
In the next example, we illustrate now the results for the binding at the PGA site on the 3pfk structure (Job ID O7D1D67M).
Clicking on the binding sites buttons will turn them red as well as the corresponding residues in the left sequence panel (see Figure 7).
By clicking the “Run analysis” button will start the calculation of the allosteric free energy per residue as a result of the modeled binding at the above binding sites.
The calculation should take a few minutes, at the end of which a new page is shown (see Figure 10).
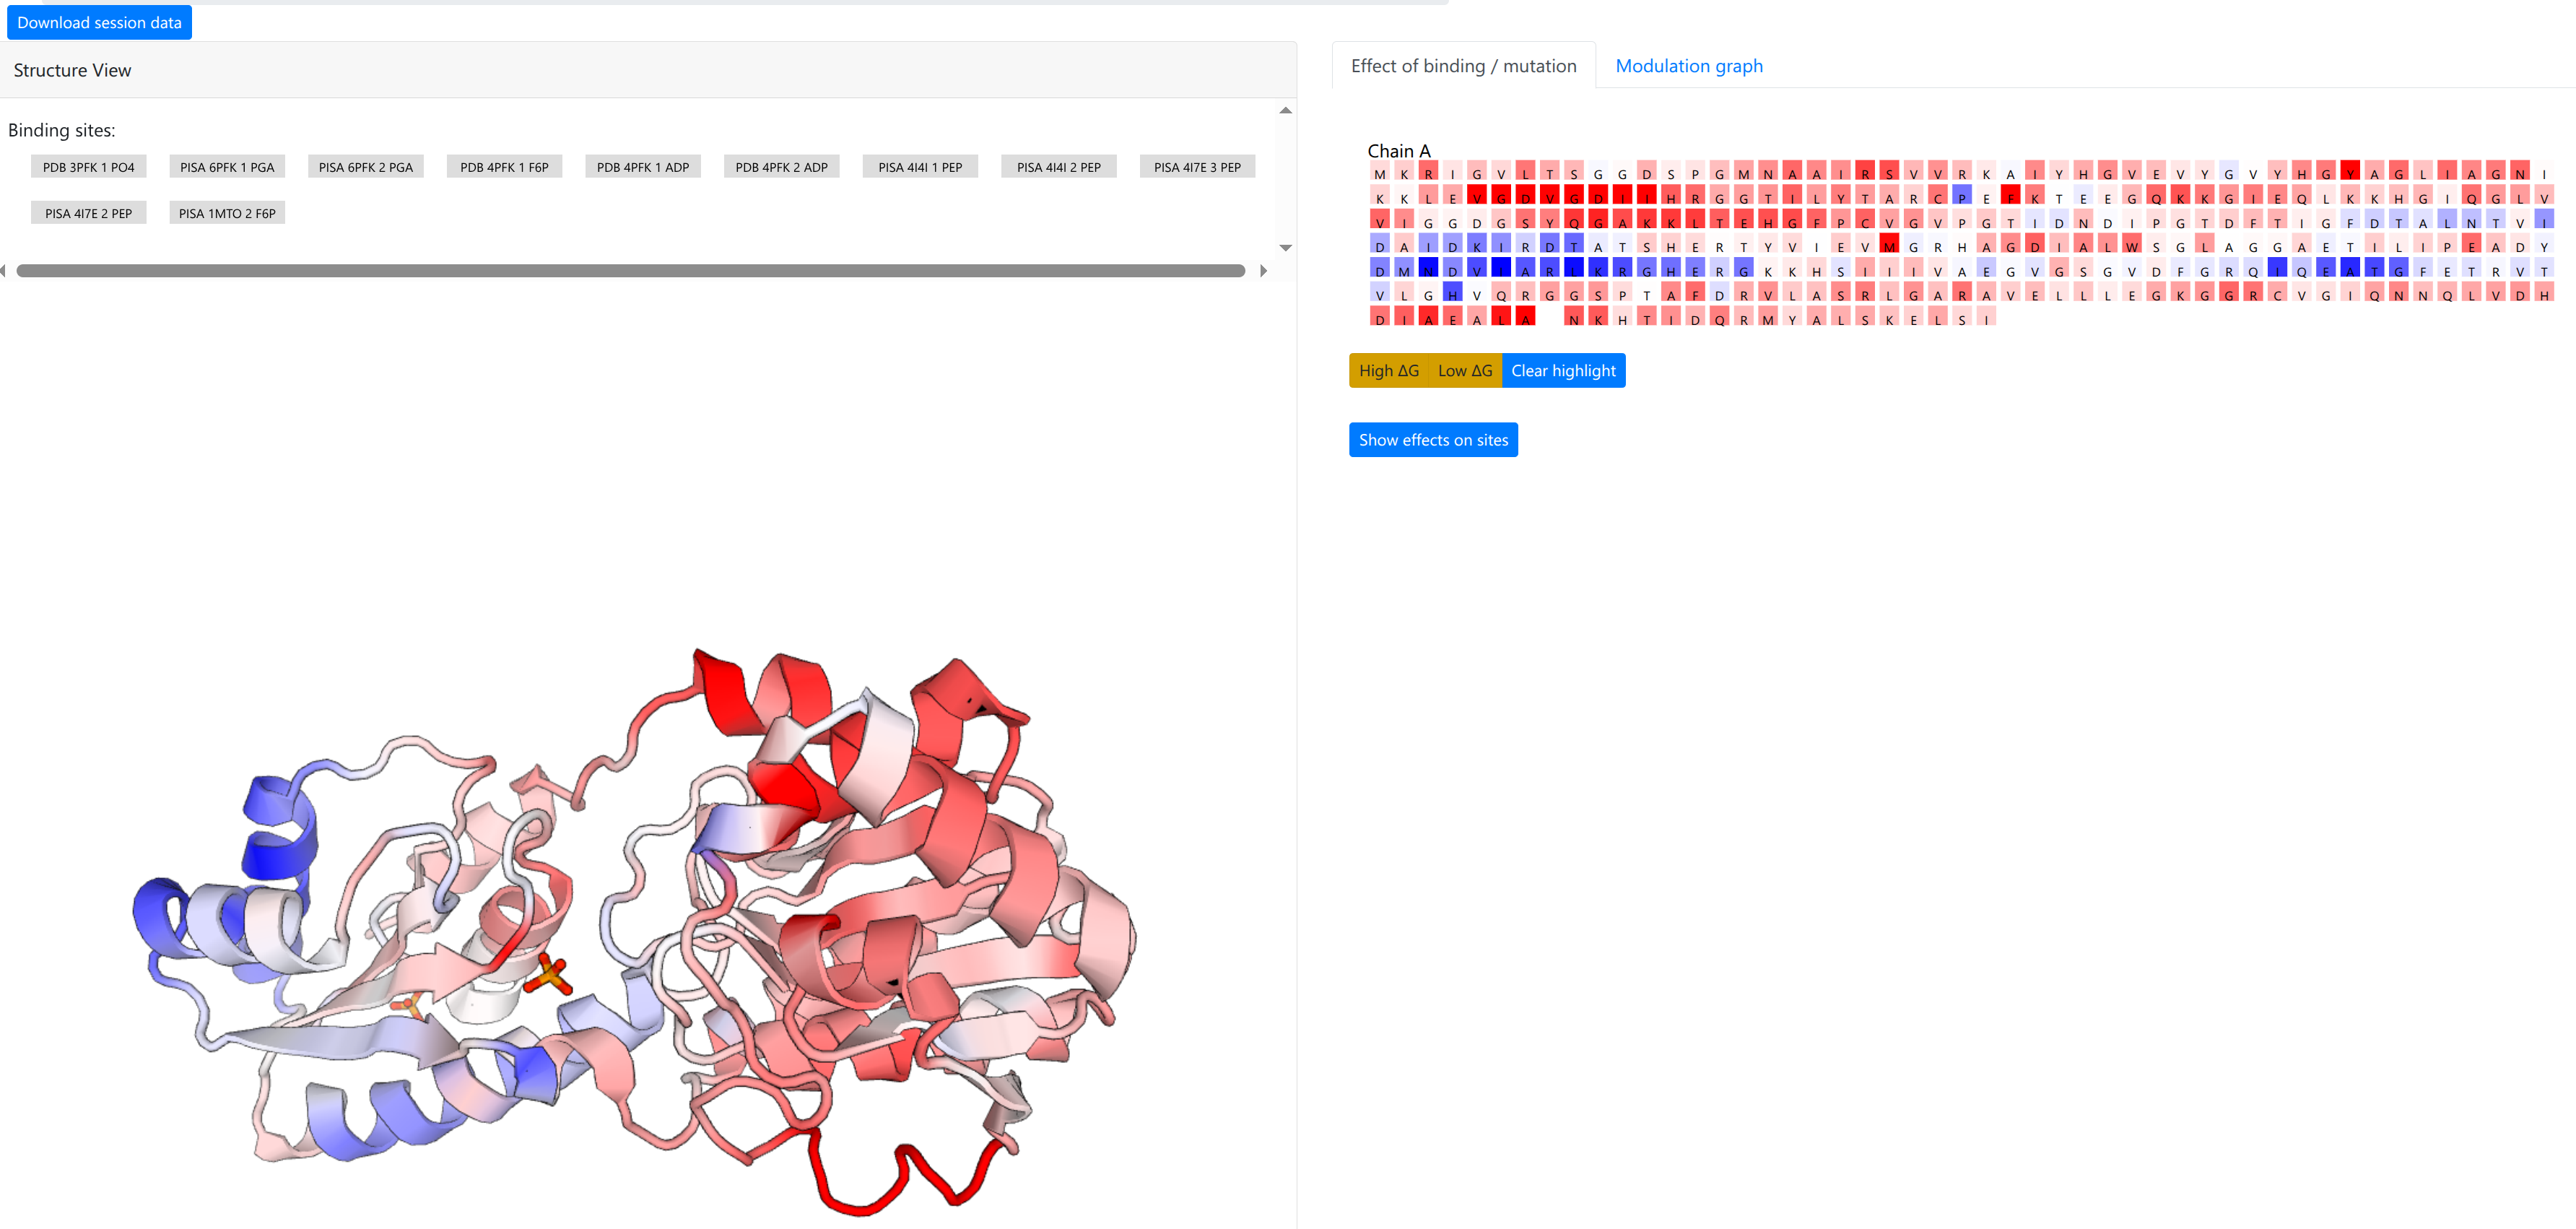
The computation result is displayed in two panels, with the left panel showing the results on the 3D spatial model, and the right panel displaying results on the protein chains and sequences.
The “Structure View” panel (Figure 9, left) lists the bound effector sites, and shows the protein with chains rendered efficiently as an interpolated tube using PV colored according to the per-residue allosteric free energy values Δgi. The allosteric free energy is the difference in work exerted on residue i between ligand-bound and ligang-free protein states. A Red-White-Blue color map is used to illustrate the energy values: Blue color (positive Δgi) indicates enhanced conformational changes, red color (negative) indicates suppresed conformational changes upon effector binding. White-colored residues have their dynamics mostly unaffected by effector binding.
Grey buttons above the structure act as controls to display the bound effector sites: pointing the mouse over the buttons highlight the bound residues as grey spheres on the structure, while clicking on the buttons highlight the bound residues on the sequence panel on the right, under the “Effect of binding / mutation” tab.
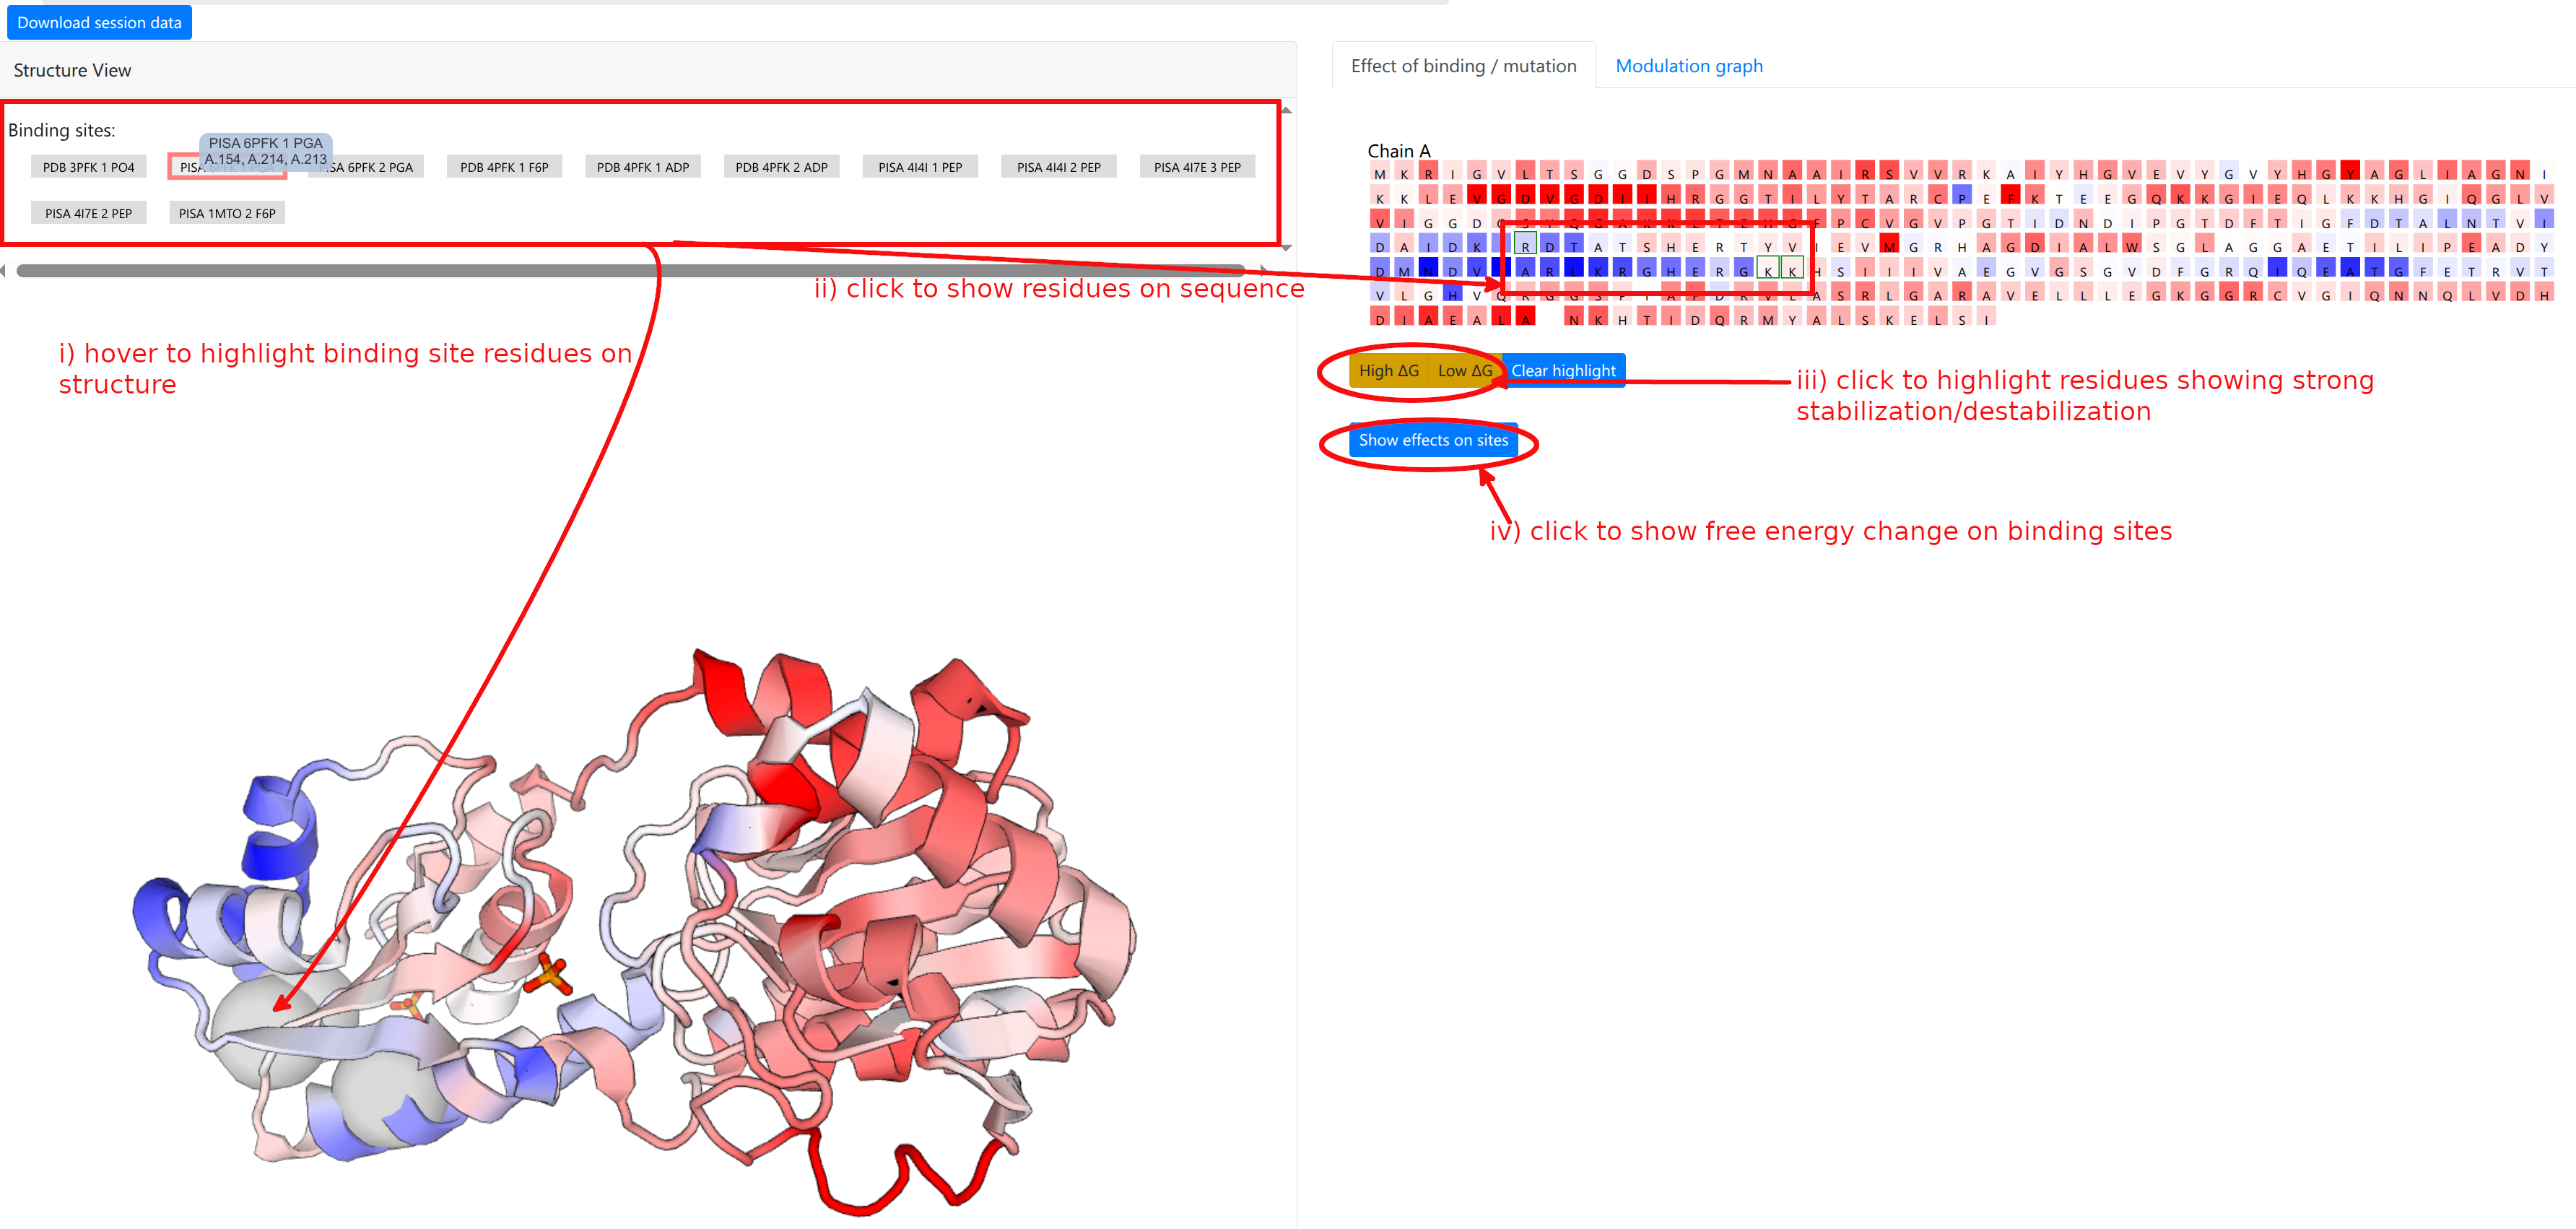
The right panel is divided into two tabs:
- Effect of binding / mutation: Protein chains and residues are shown, colored according to the allosteric free energy values. Pointing the mouse over a residue allows the user to see the corresponding free energy value in kcal/mol. Residues that show a strong conformational changes (high Δg) or constraining (low Δg) can be highlighted using the yellow buttons below the sequences, and the overall free energy change in the selected binding sites can be obtained by clicking “Show effects on sites” at the bottom of the panel.
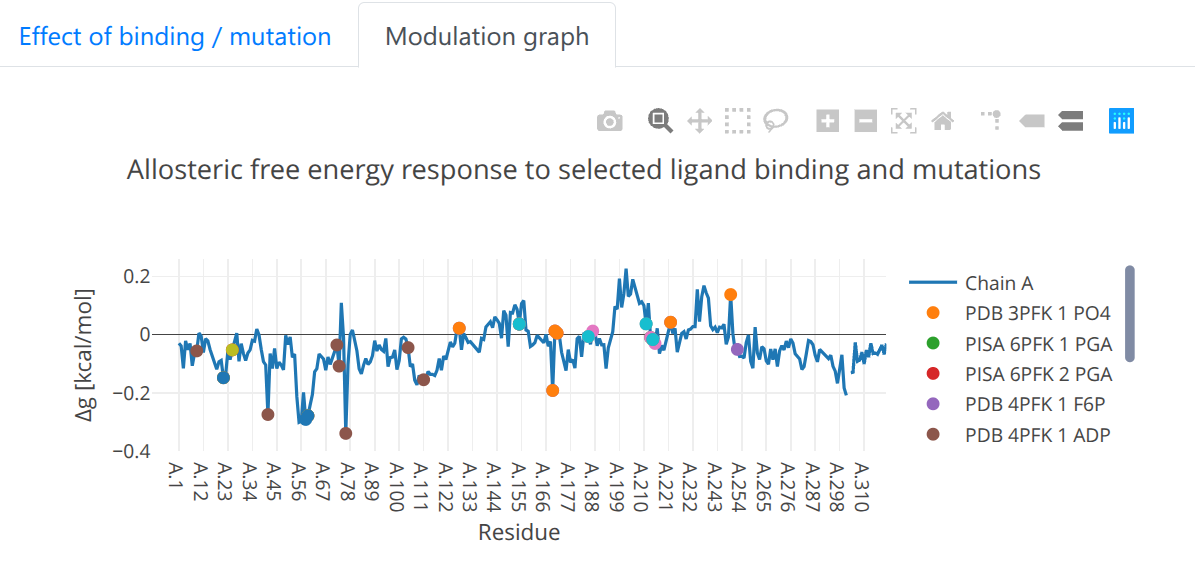
- Modulation graph: The free energy change is shown on a linear graph along the protein sequence (see Figure 12), using the Plotly package. Bound sites and mutations are annotated on the graph for convenience. Interactive exploration of the data can be performed using standard tools provided in Plotly.
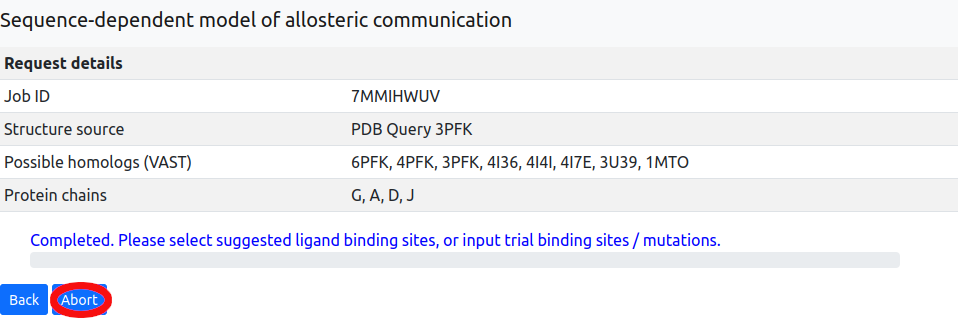
Cancelling jobs
In the event that a user needs to cancel a job, an Abort feature has been implemented to allow the user to terminate a running job, removing all associated data from the server (see Figure 13). This option is available on the Results page, which can be reached immediately after job submission (a page refresh may be required to unlock the interface on some browsers), or accessed later using the Restore session function on the main page.
Downloading data files
Clicking on the “Download session data” button located in the upper left side of the page allows the user to download a zip-compressed file that is named according to the Job-ID.zip. The contents of the archive depends on the mode of operation selected.
For "Binding sites and mutations" jobs, the archive contains three files and a folder with the following data:
- the *.pdb file of the structure with allosteric free energies in the place of residue temperature factors
- the *.png file of the free energy profiles of individual chains
- the *.txt file containing residue names/numbers and corresponding free energies in kcal/mol.
- the WorkFiles folder contains machine-read data in json and pdb format required for restoring old sessions that have been removed from the server. Given the current user traffic, sessions more than three months old will be cleared from the server.
For "Allosteric signaling/probing map" jobs, the archive contains three PDF files of the ASM/APM plots, and a WorkFiles folder containing the PDB structure file, miscellaneous files required for restoring old sessions, as well as the following useful JSON files:
- *_mutationlist.json, the list of mutated residues tested in ASM computation
- *_probelist.json, the list of positions of small binding probes tested in APM computation
- *_responselist.json, the list of residues on which free energy changes is computed
- *_ASM_UP.json, a 2-dimensional array ΔgUPij, where the row-index i corresponds to the residue being UP-mutated, and column-index j refers to the residue showing the given free energy change. The 2D array for DOWN mutations is similarly named, as are the APM arrays.
Note: We suggest that users download and archive session data files for future reference, as sessions older than three months will be removed from the server cache. Data for these removed sessions may still be visualized on the server using the Visualize Session Data tab.
Benchmarking
Running ‘binding sites' and 'mutations’ jobs with the sequence-dependent model usually requires less than 15 minutes.
| Protein PDB code | Number of residues | run time for Mutation | run time for Binding |
|---|---|---|---|
| 3PFK | 1276 | 6s (< 1 minute) | 22s (< 1 minute) |
| 1RUN | 398 | 3.5s (< 1 minute) | 3s (< 1 minute) |
| 2D1N | 166 | 2s (< 1 minute) | 2s (< 1 minute) |
| 1PGB | 56 | 1s (< 1 minute) | 1s (< 1 minute) |
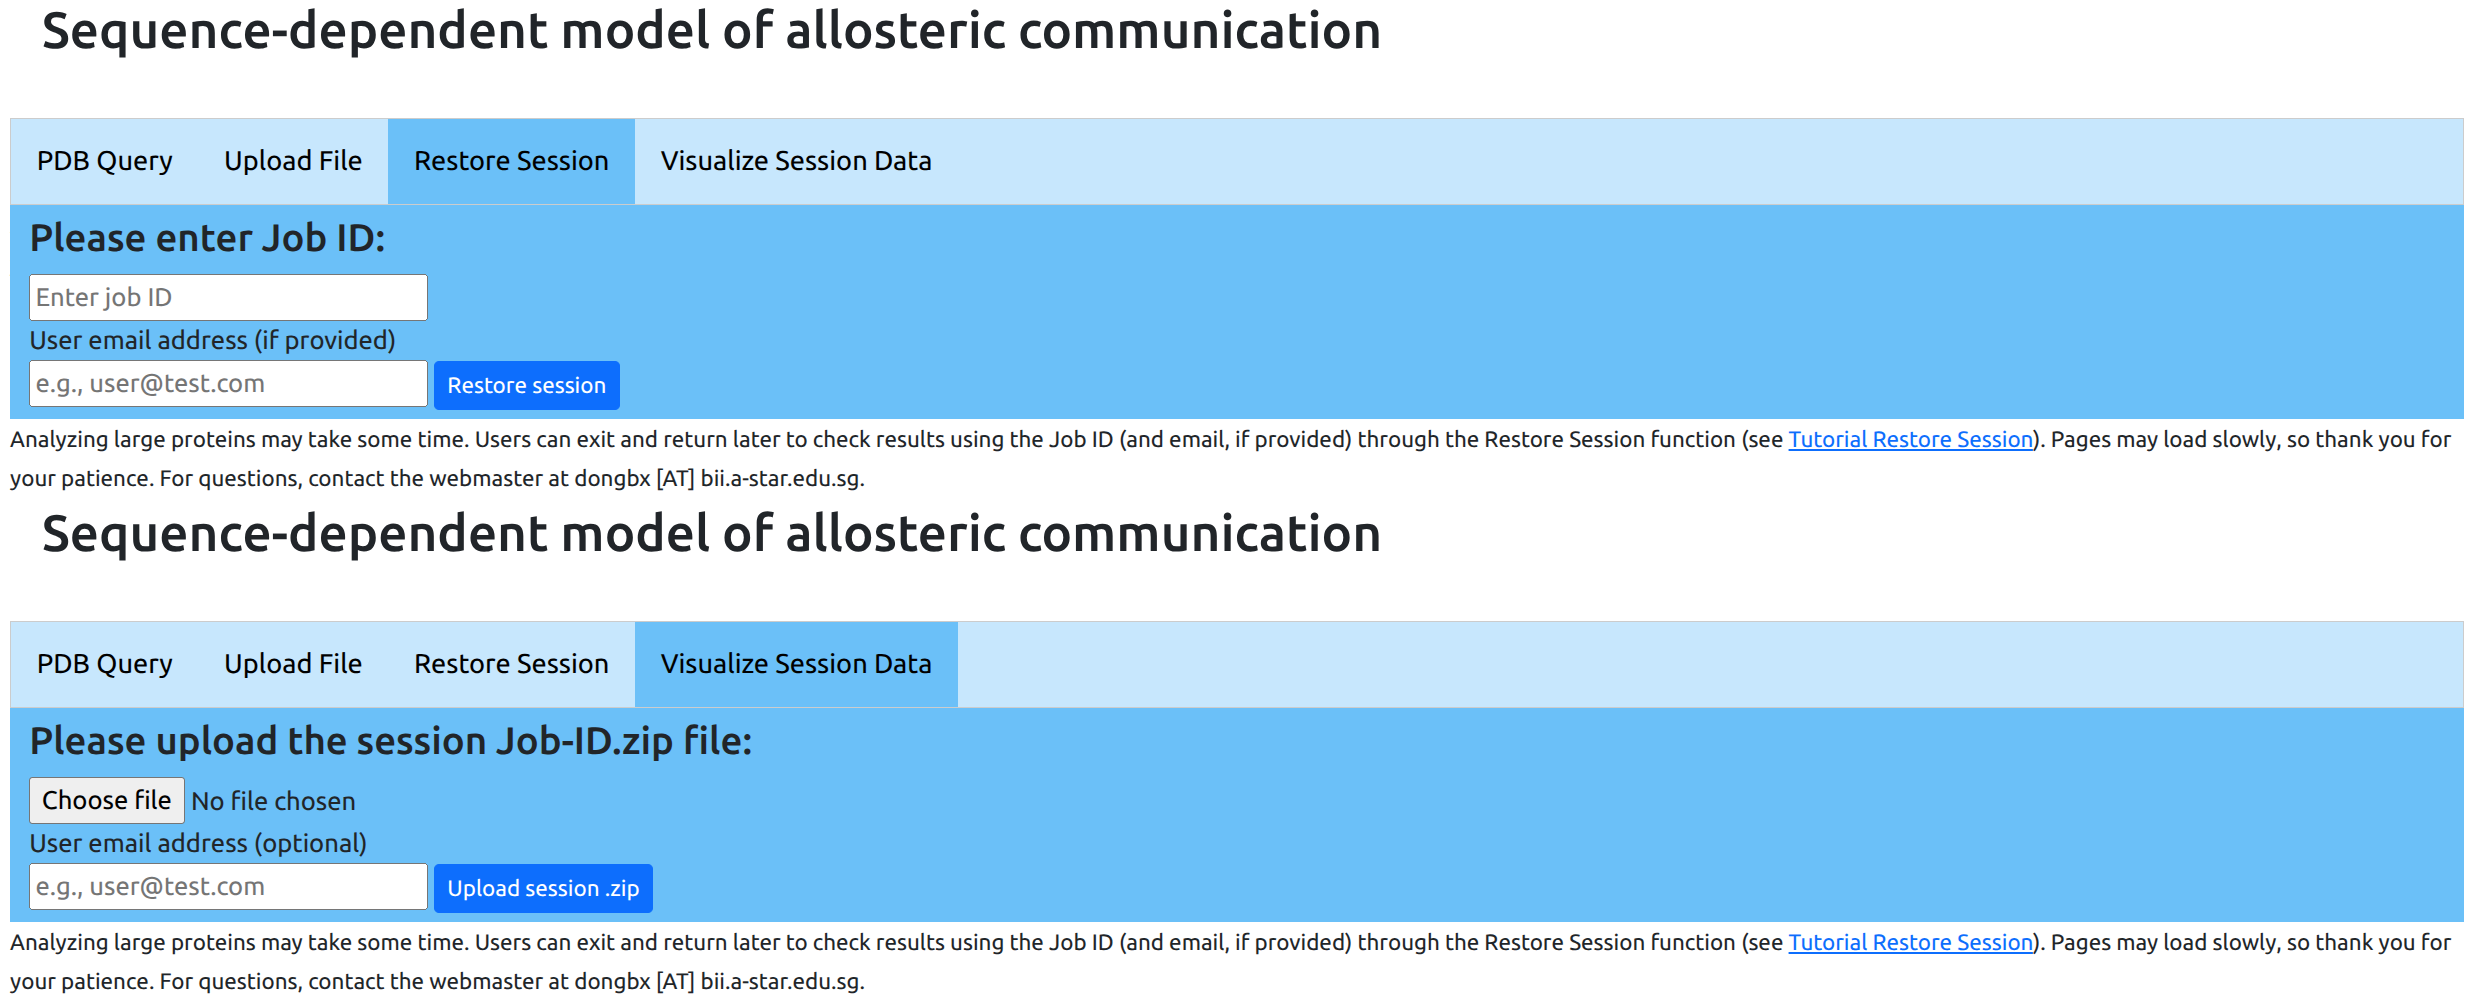
Restoring or visualizing old sessions
Users may access data from previous sessions through the "Restore Session" and "Visualize Session Data" tabs in the Sequent-Dependent Model page (see Figure 14). For sessions less than 3 months old, users may return to the last step reached by entering the Job ID (as well as the user email address, if provided), and resume with further computations if necessary. This is useful also when submitting jobs for large proteins that require long computation times: the user may exit the browser, and return at a later time to check if the request has been completed.
For sessions more than 3 months old, the user may upload the session Job-ID.zip file (explained here) for visualization purposes. We recommend that users download and archive session data files for future reference, as old sessions will be removed from the server cache.
PDB file format
Please ensure that uploaded PDB files have the ATOM (atomic coordinates) section formatted as follows, according to PDB entry format version 3.3:
ATOM      1  N   MET A   1      12.969  18.506  30.954  1.00 15.93           N
ATOM      2  CA  MET A   1      13.935  18.529  29.843  1.00 17.40           C
ATOM      3  C   MET A   1      13.138  18.692  28.517  1.00 14.65           C
ATOM      4  O   MET A   1      12.007  18.222  28.397  1.00 13.04           O
ATOM      5  CB  MET A   1      14.733  17.216  29.882  1.00 20.72           C
Note that deviations from the accepted PDB format may result in irregular behavior of the server.
Note on browsers
The AlloSigMA web service has been tested on the following browsers:
| Operating System | OS Version | Chrome | Firefox | Microsoft Edge | Safari |
|---|---|---|---|---|---|
| Linux | Ubuntu 22.04.5 LTS | 139.0.7258.138 | 142.0.1 | — | — |
| macOS | Sonoma 14.7.6 | 140.0.7339.81 | 142.0.1 | — | 17.6 |
| Windows | 10 Pro (Build 19043.2075) | 140.0.7339.81 | 142.0.1 | 140.0.3485.54 | — |
Note that Safari browser users may encounter issues when processing protein structures with long residue chains due to browser's settings.
For optimal user experience, we recommend using Mozilla Firefox.
References
- Sequence-dependent model of allosteric communication E. Guarnera, and I. N. Berezovsky. The Journal of Chemical Physics, 2023 vol. 158 p. 135101.
- AlloSigMA: allosteric signaling and mutation analysis server E. Guarnera, W.-V. Tee, Z. W. Tan and I. N. Berezovsky Bioinformatics, 2017 vol. 33 (24) p. 3996-3998
- AlloSigMA 2: paving the way to designing allosteric effectors and to exploring allosteric effects of mutations Z. W. Tan, E. Guarnera, W.-V. Tee and I. N. Berezovsky. Nucleic Acids Research, 2020 vol. 48 p. W116-W124.
- Structure-Based Statistical Mechanical Model Accounts for the Causality and Energetics of Allosteric Communication. E. Guarnera and I. N. Berezovsky. PLoS Comput Biol, 2016 vol. 12 (3) p. e1004678.
- Towards comprehensive allosteric control over protein activity. E. Guarnera and I. N. Berezovsky. Structure, 2019 vol. 27 (5) p. 866-878.e1
- Allosteric sites: remote control in regulation of protein activity E. Guarnera and I. N. Berezovsky. Curr Opin Struct Biol, 2016 vol. 37 p. 1-8.
- Allosteric drugs and mutations: chances, challenges, and necessity. E. Guarnera and I. N. Berezovsky. Curr Opin Struct Biol, 2020 vol. 62 p. 149-157.
- Allosteric drugs: New principles and design approaches. W.-V. Tee and I. N. Berezovsky. Curr Opin Struct Biol, 2024 vol. 84 p. 102758.